
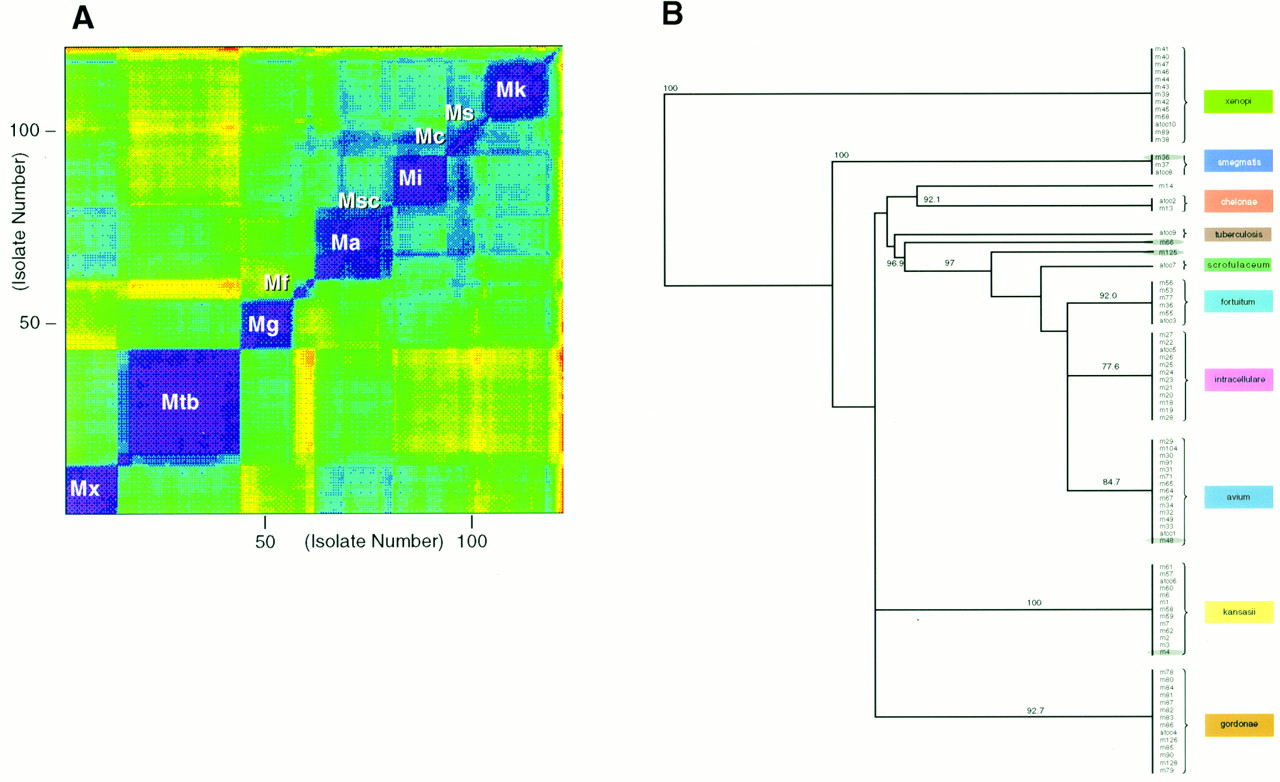
(A) Results of hybridization patterns of 121Mycobacterium isolates analyzed by linear regression assays (SAS Institute 1990). Only probes complementary to the wild-type sequence of the rpoB gene of M. tuberculosis were used in the analysis (i.e., 25%) of probes. The pairwise comparison of the 1 − r 2 values for each of the 121 isolates was performed and like values clustered. The contour plot represents values for 1 (purple) to 0 (red). (Mx) M. xenopi, (Mt) M. tuberculosis, (Mg) M. gordonae, (Mf) M. fortuitum, (Msc) M. scrofulaceum, (Mi) M. intracellulare, (Mc) M. chelonae, (Ms) M. smegmatis, and (Mk) M. kansasii. (B) Results of hybridization patterns analyzed by use of principle component assays. Using all of the 5648 probes on the rpoB array, each of the isolates was clustered on the basis of 15 orthogonal components. The clustering of the isolates was represented by an unrooted nearest neighbor joining tree. The six isolates noted in Fig. 3 are highlighted in this tree.


