
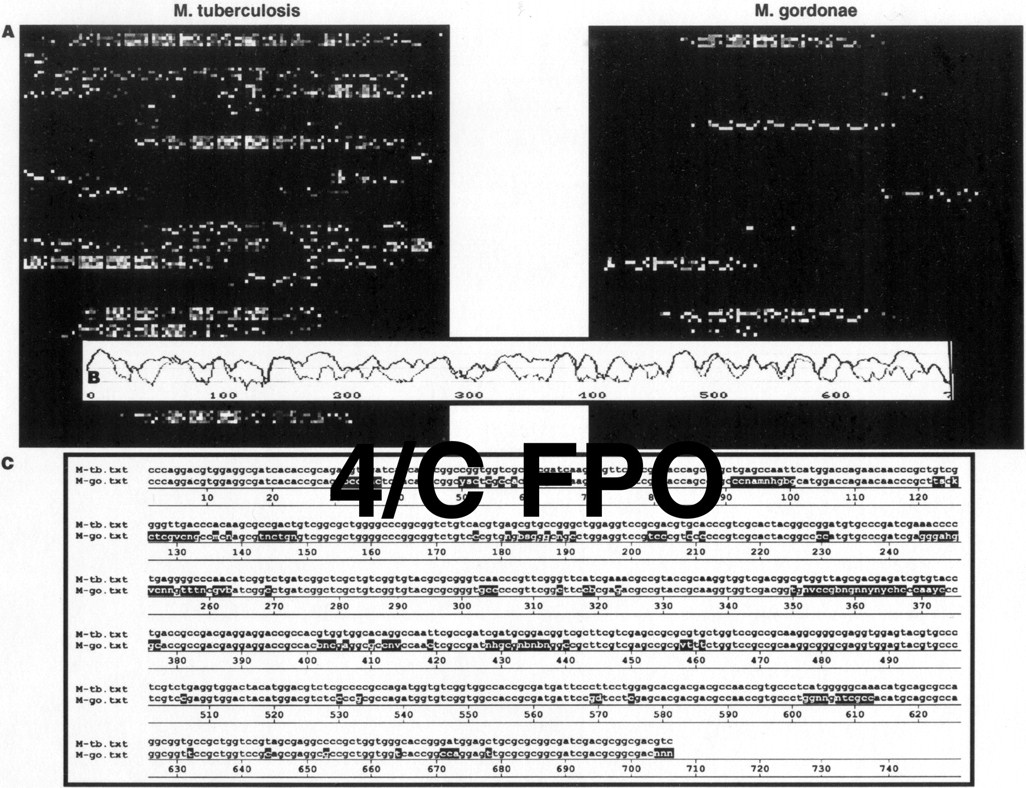
(A) Hybridization patterns produced on an oligonucleotide array that have probes selected to be complementary to the 705 bases ofM. tuberculosis rpoB gene sequence. The amplified, fluorescently labeled 705-bp antisense product from the rpoBgenes of M. tuberculosis and M. gordonae are presented. A total of 5648 oligonucleotide probes were used to interrogate each of the 705 bp in the amplified product. (B) The intensity of hybridization for each of the 705 probes that are complementary to the wild-type sequence (Miller et al. 1993) of theM. tuberculosis rpoB gene is plotted as a function of the base interrogated in the gene sequence. The blue and red plots are the intensity profiles of M. tuberculosis and M. gordonaeimages shown in A. The intensities are obtained from GeneChip software (see Chee et al. 1996; Kozal et al. 1996) and are plotted and compared using the Ulysses software program (Chee et al. 1996). (C) The identity of each base in the 705 bp of therpoB amplicons is determined by the hybridization results of eight probes (four for each strand). The sequences derived from the images in A for M. tuberculosis (M-tb) and M. gordonae (M-go) are shown. Differences between the two genes are denoted by highlighted bases in the M. gordonae sequence. Of these differences, 61% (95/155) of the positions can be identified as specific polymorphic differences between the two species. The remainder of the differences are unidentified or marked by IUPAC ambiguity code. Of the positions identified as a polymorphic difference 7/33 bases correspond to species-specific polymorphisms present in all isolates ofM. gordonae (Table 2).


