
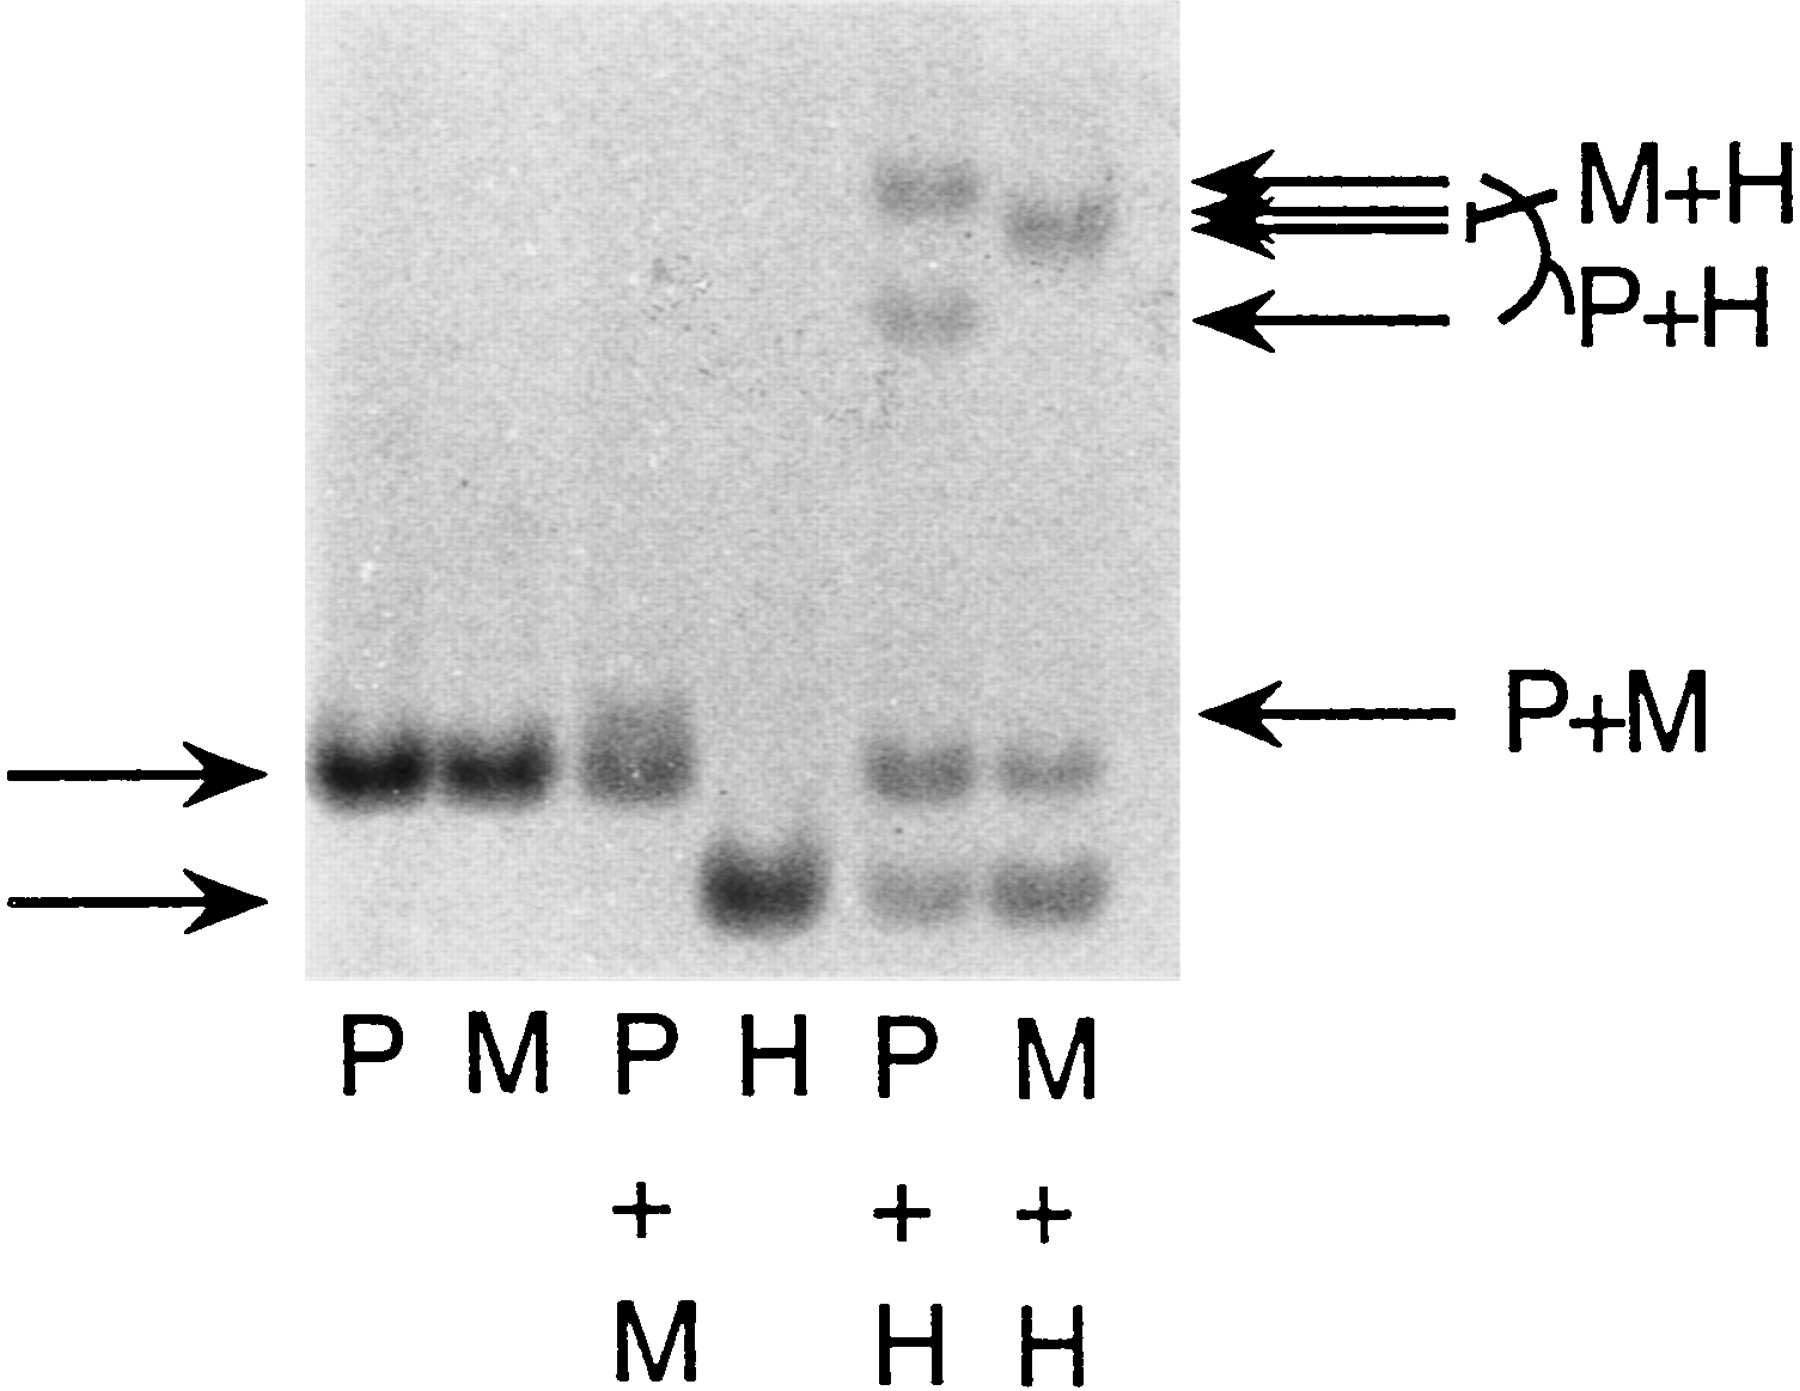
Figure 2.
A silver-stained native polyacrylamide (8%) gel showing the separation of a 150-bp PCR product of the PAX8 gene amplified from pig (P), mouse (M), and human (H) genomic DNA; P + M, P + H, and M + H were mixed subsequent to the PCR amplification but prior to the denaturation/renaturation treatment. Homo- and xeno-duplexes are marked by arrows to the left and right, respectively.


