
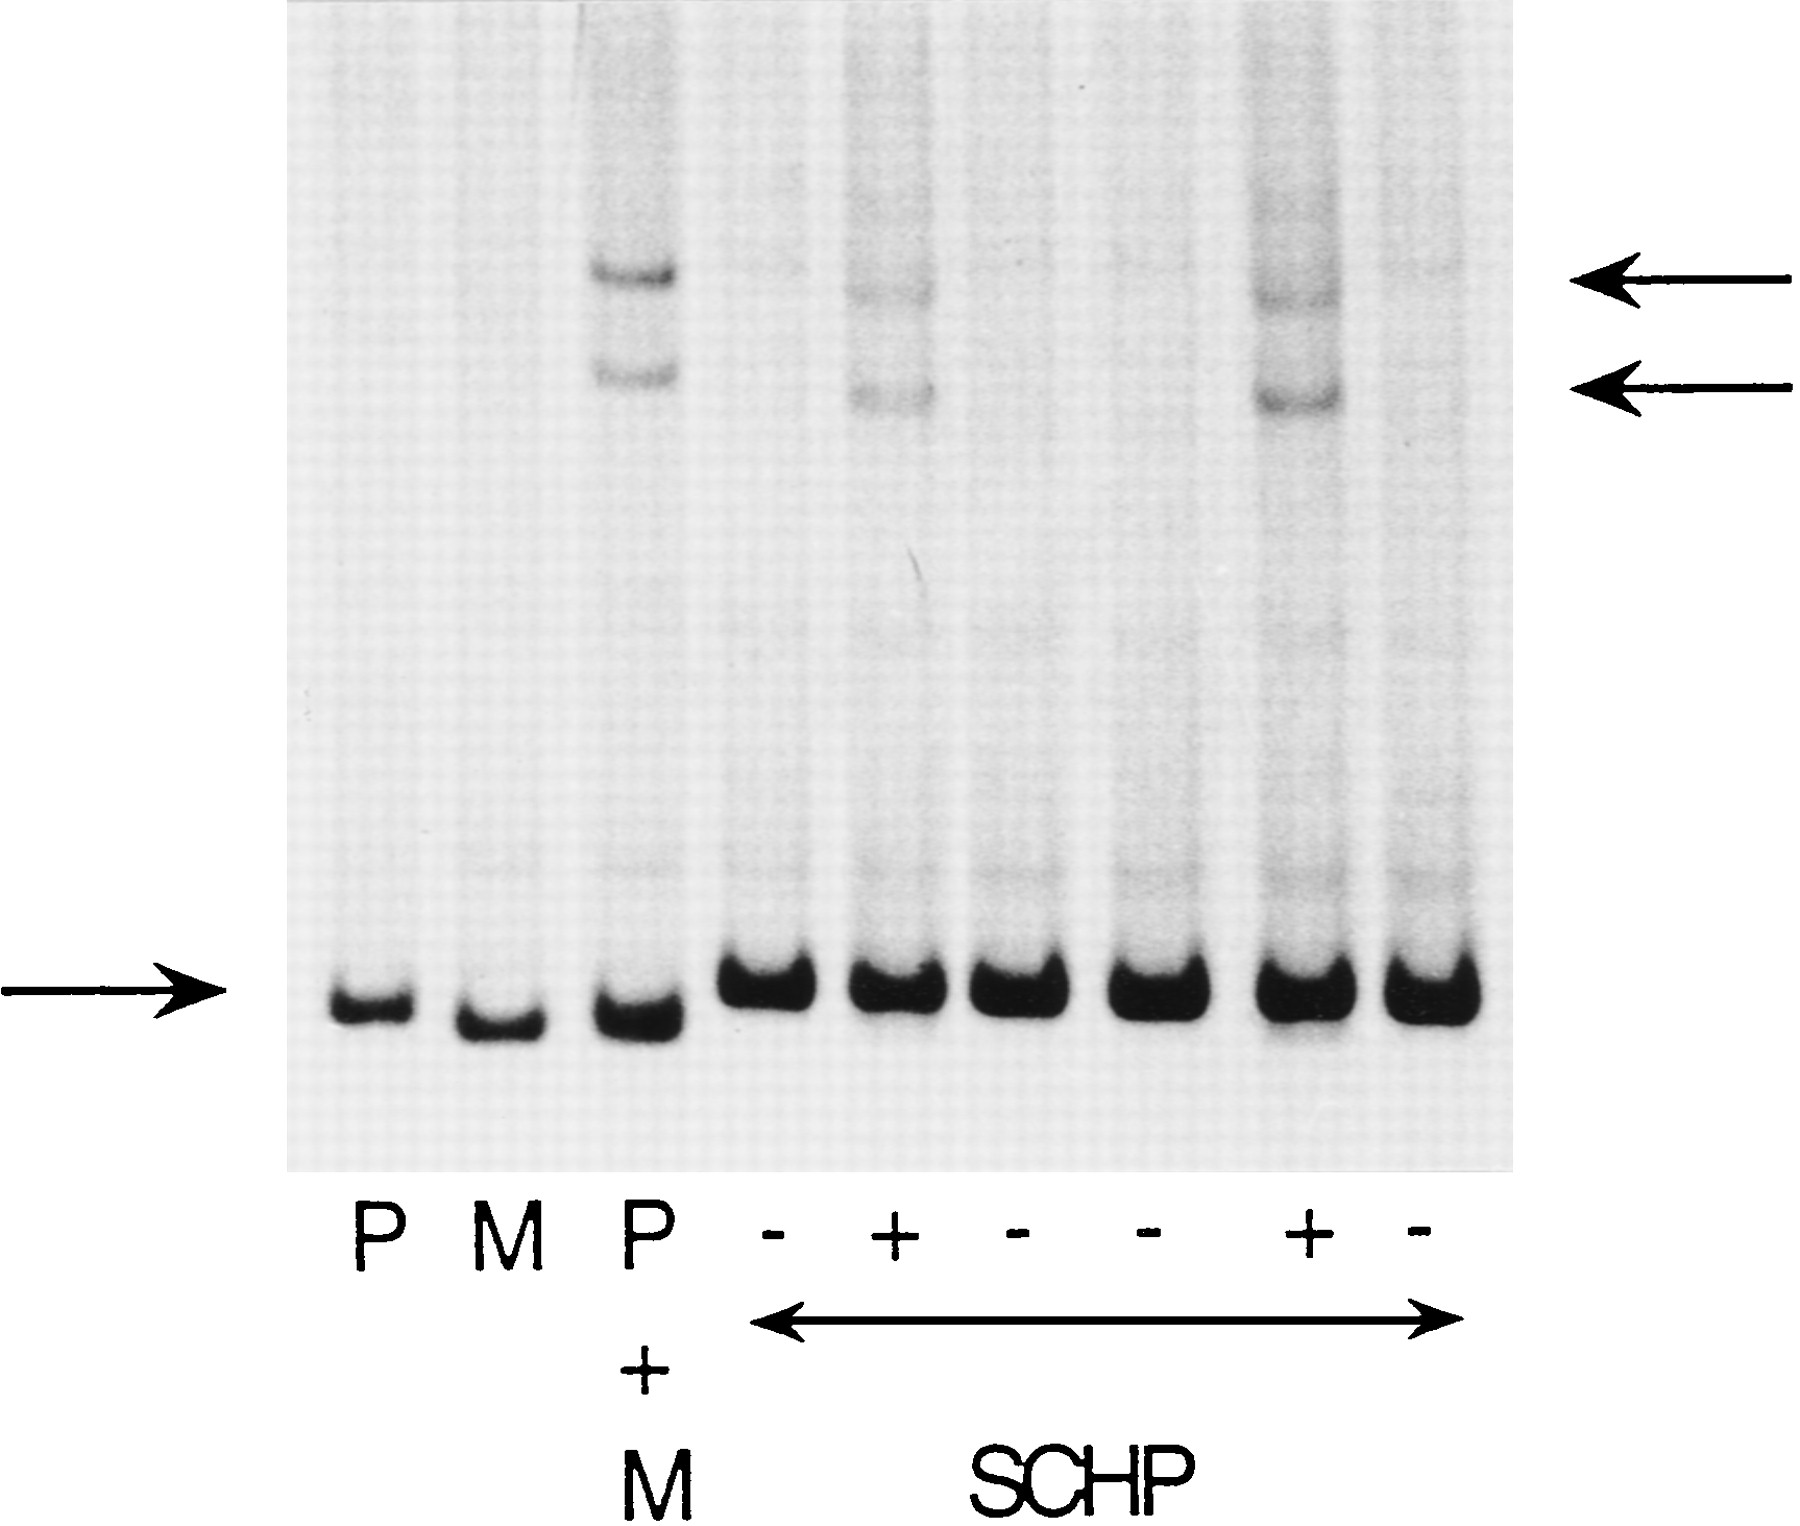
Figure 1.
A silver-stained native polyacrylamide (8%) gel showing the separation of a 333-bp PCR product of the PKLR gene amplified from pig (P), mouse (M), and six clones from a pig/hamster SCH panel; P + M was mixed subsequent to the PCR amplification but prior to the denaturation/renaturation treatment. Homo- and xenoduplexes are marked by arrows to the left and right, respectively. SCH clones that were scored positive and negative for the pig PKLRgene are marked by + and −, respectively.


