
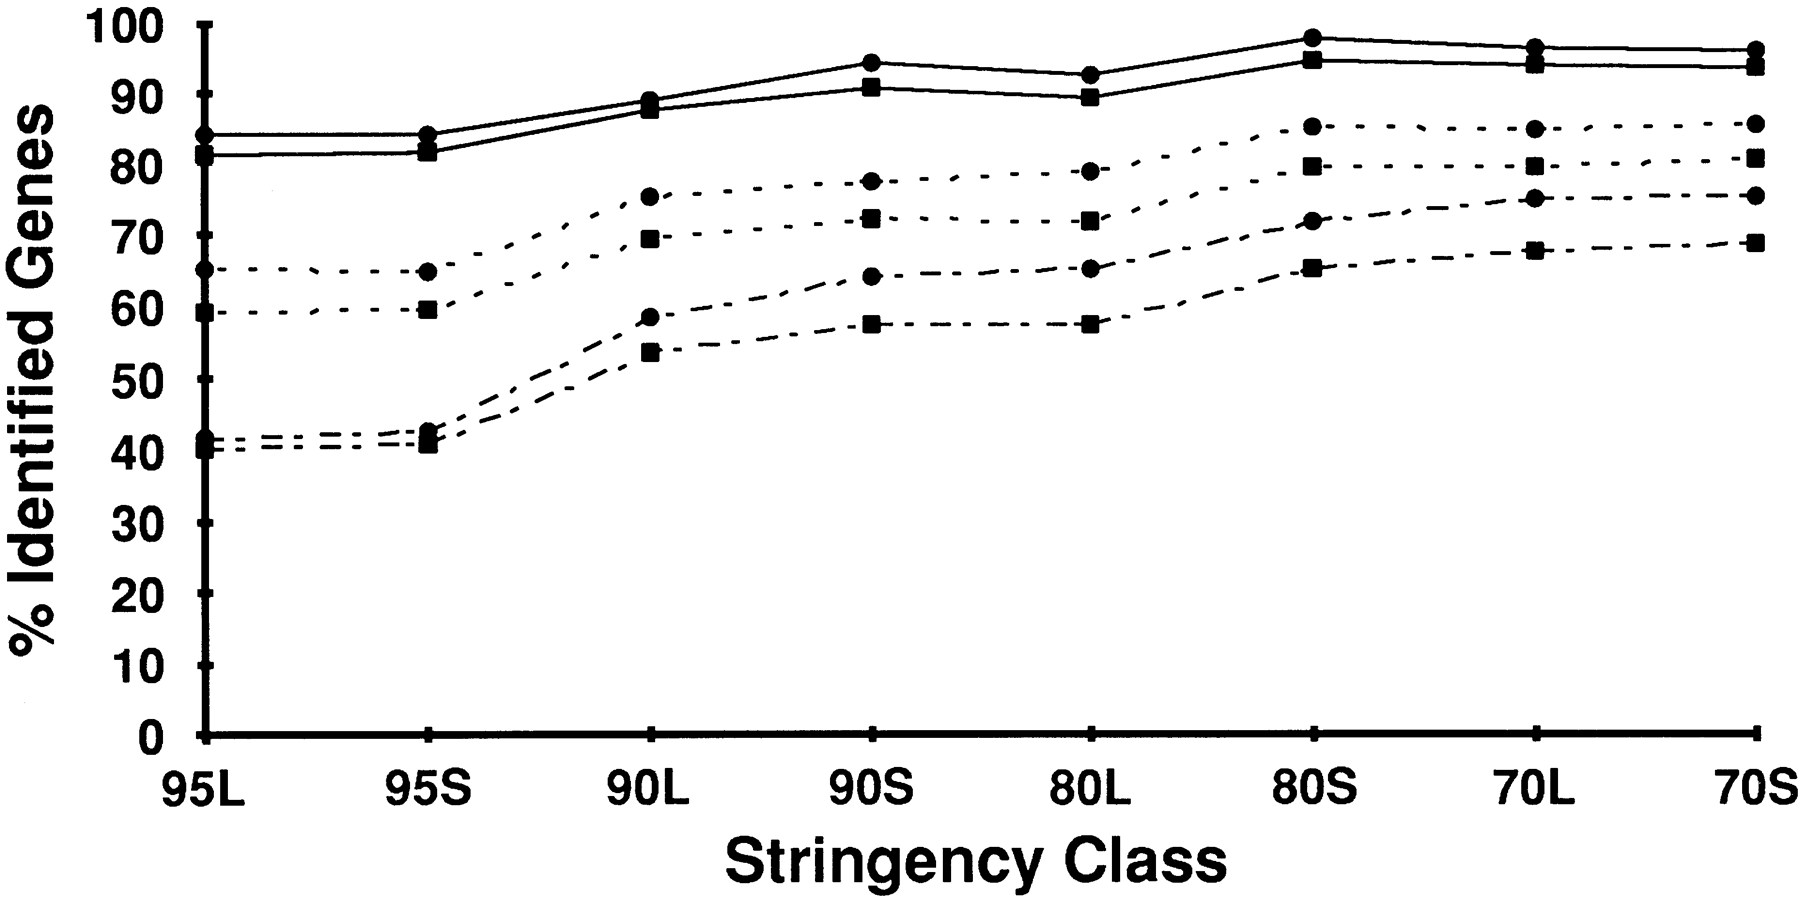
Figure 3.
Diversity of cDNAs identifying annotated genes. For each stringency class, the fraction of all identified genes that were detected by ESTs arising from >1 cDNA library (—), 5 or more cDNA libraries (- - -), or 10 or more cDNA libraries (– - –) is shown. (▪) Data for set AS; (•) data for set WG.


