
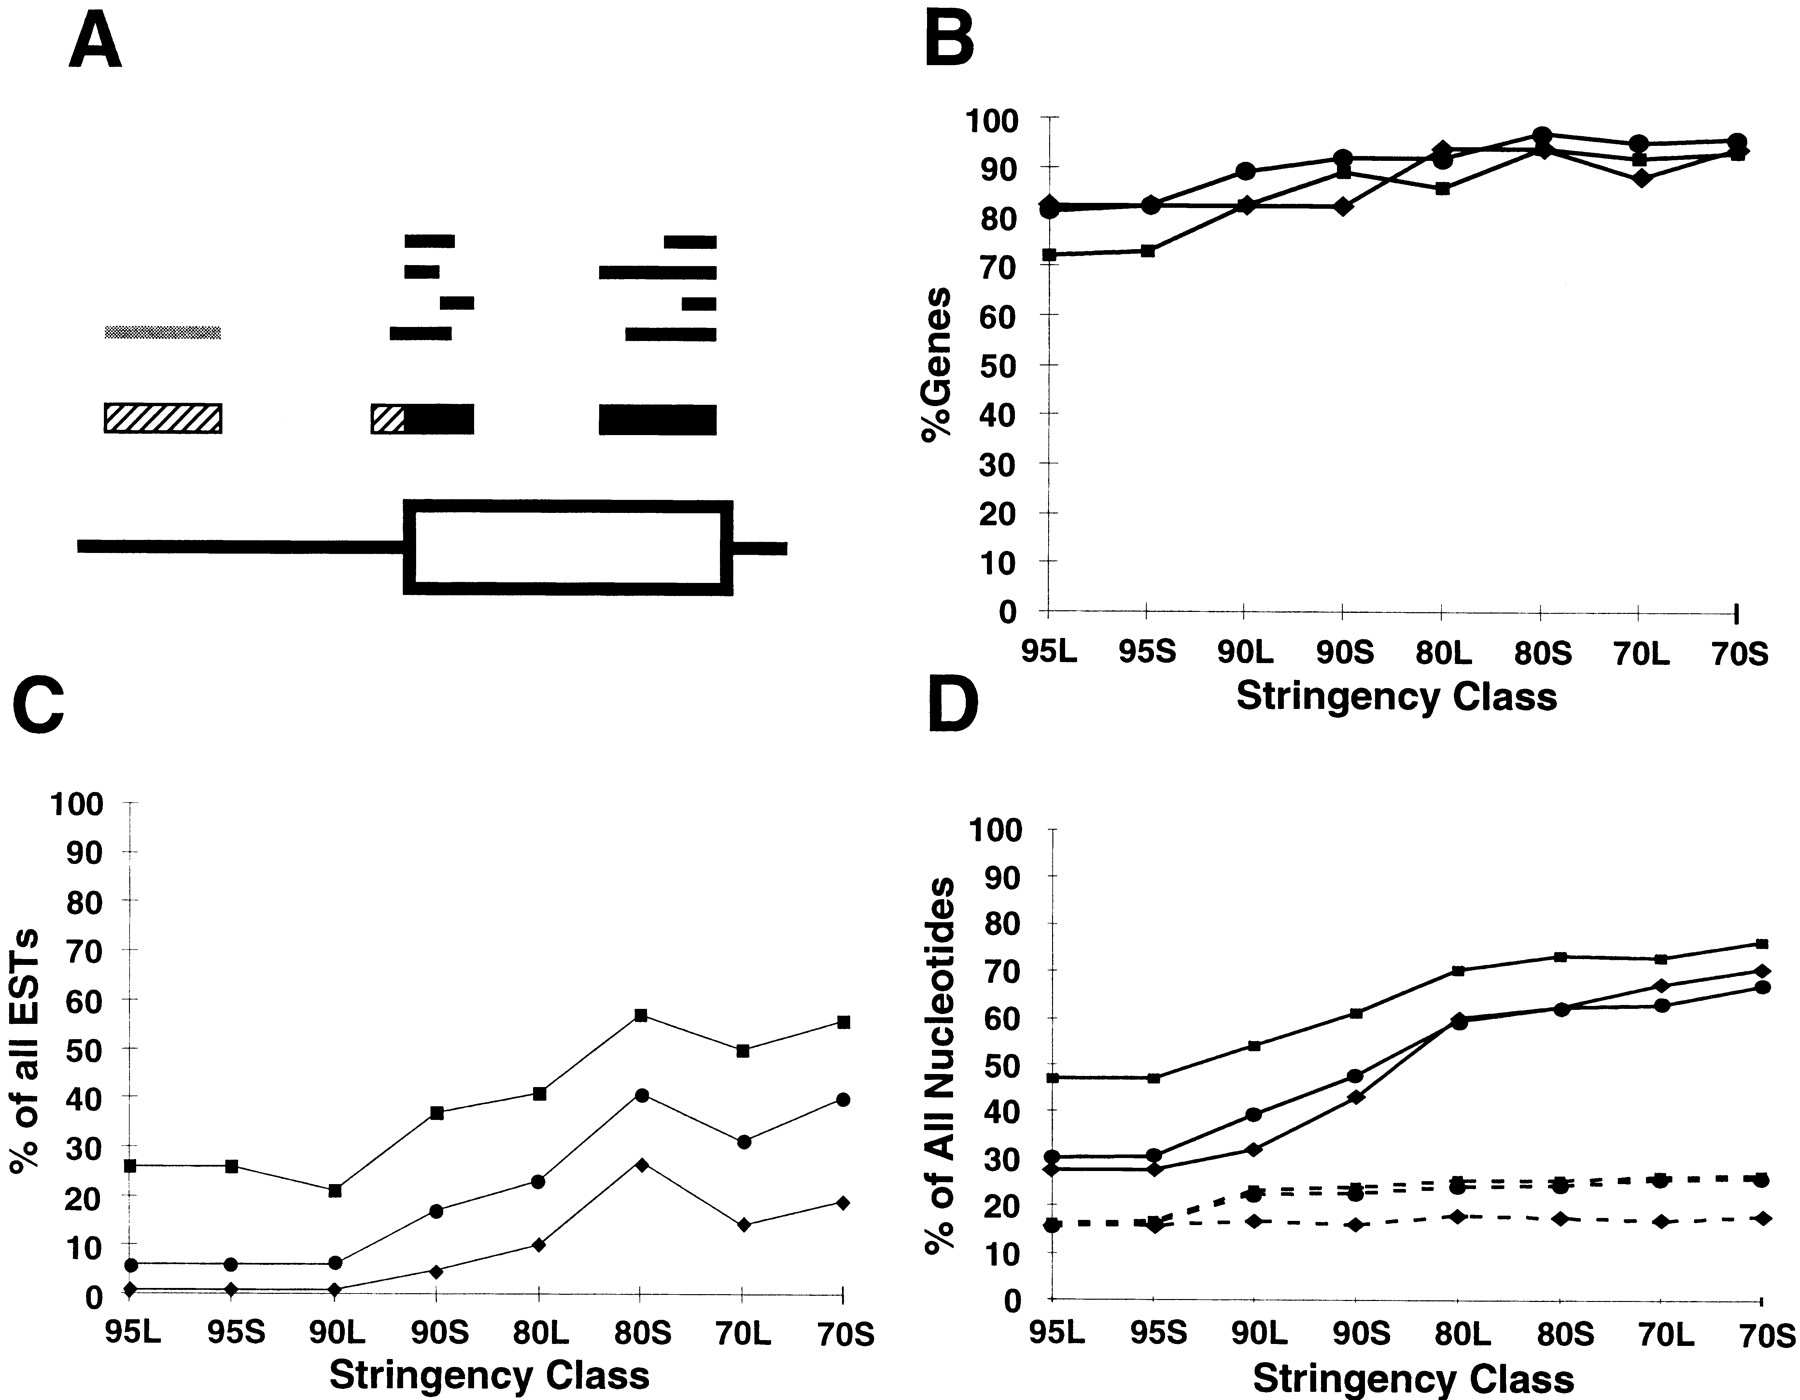
Correlation of EST results with annotated genes. (A) Determination of overlap between EST alignments and annotated genes. The bottom line shows the exon/intron structure of a portion of a hypothetical gene. The top tier of bars denote individual EST alignments; those in black are scored as overlapping the gene, whereas those in gray are scored as complete misses. Themiddle tier shows the projected CRs derived from these alignments; nucleotides in the black portions of CRs are scored as falling within an annotated exon, whereas those in the hatched portions are scored as falling outside of known excons. (B) Fraction of all annotated genes that were identified by at least one EST alignment. (▪) Data for set AS; (•) data for set WG; (♦) data for set BE. (C) Fraction of all EST alignments that do not overlap annotated exons. (D) Fraction of nucleotides in projected EST alignments that do not fall within annotated exons. EST alignments with each genomic query sequence were projected onto the query sequence as described in the text. Solid lines denote fraction of nucleotides from all projected CRs; broken lines denote fraction of nucleotides from projected CRs at least partially overlapping annotated exons.


