
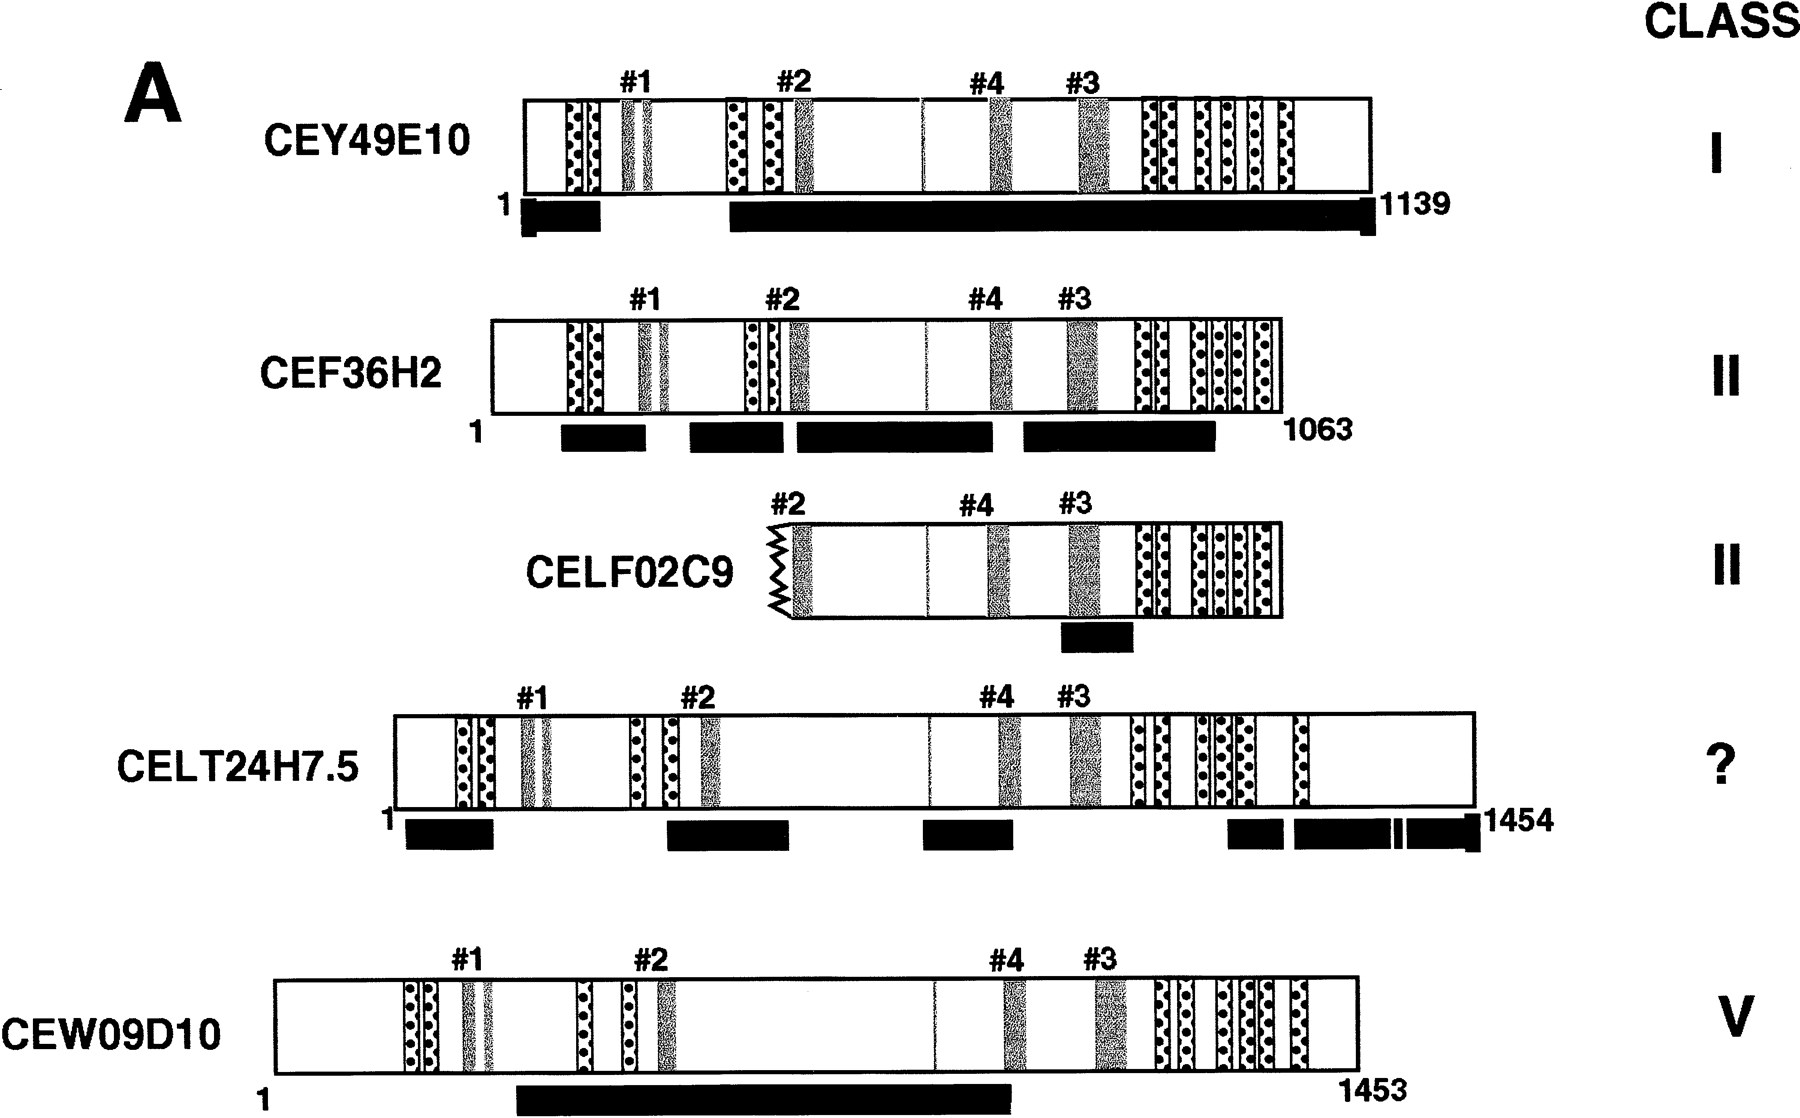
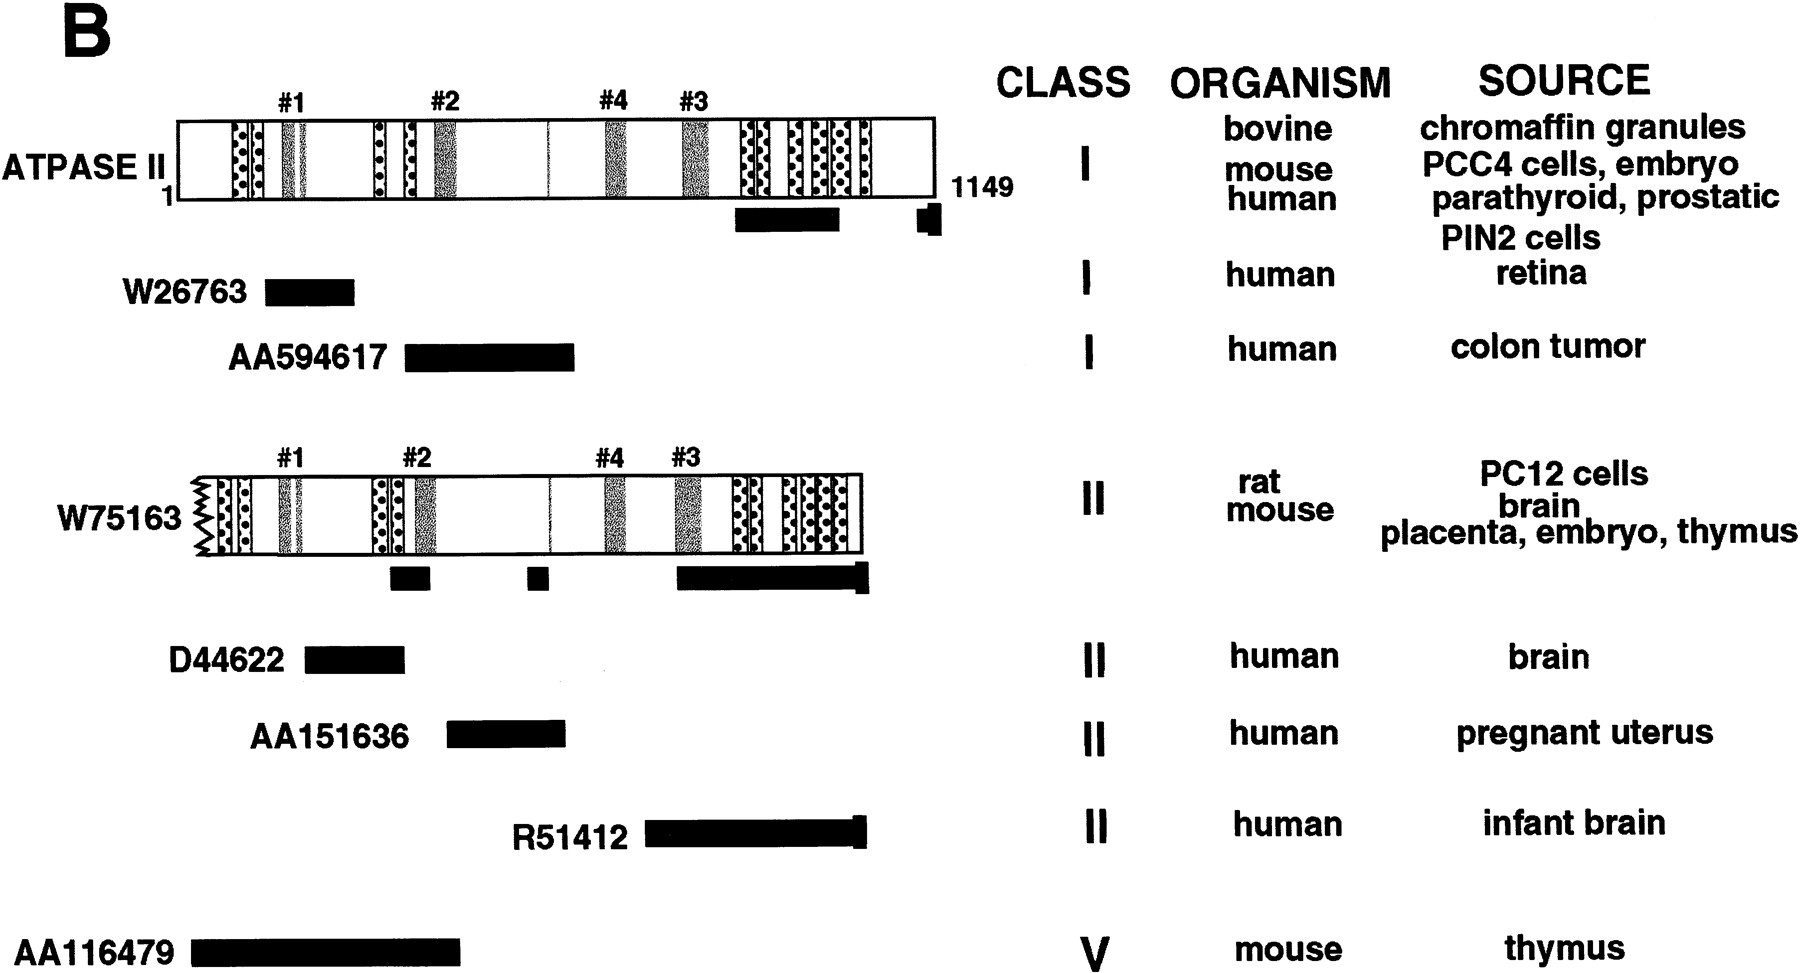
C. elegans and mammalian subfamily members. (A) Proteins translated from five C. elegans genomic sequences. Black bars underneath the annotated diagrams represent EST cDNA amino acid sequences identical to those derived from the corresponding genomic sequences. Translated proteins from genomic sequences CEY49E10, CEF36H2.1, CELF02C9.3, CELT24H7.5, and CEW09D10 were predicted by Genefinder, as described in Methods. EST cDNAs D34857, D68551, D34761,D36536, C46723, and C12815 are derived from genomic sequence CEY49E10;C62504, C61119, C61257, C64739, C63236, C62558, C64835, D37065, D35631,D34828, and D35545 from CEF36H2.1; C71645 from CELF02C9; C60978,C60796, D33790, D36710, D64692, D64829, D66617, D68066, D70457, D72885,D75837, and M89042 from CELT24H7.5; and C64755, C63577, C63707, C63104,C65800, C65500, C65912, C64572, C65850, D67512, and D27733 from CEW09D10. (B) Proteins translated from mammalian cDNAs. Annoted diagrams represent the complete mammalian class I ATPase II (U75321) sequence and the nearly complete class II EST cDNA sequenceW75163 (AF011336). Black bars directly below these sequences represent EST cDNA sequences encoding proteins identical with those diagrammed (AA387574, W39181, AA225031, AA224982, AA652796 with class I ATPase II;AA510705, W50374, AA016798, AA061973, AA039159, AA039035, AA200493,AA200511, AA198017, W55124, H35595, and H32606 with class II W75163). Other black bars represent EST cDNA sequences not identical with those diagrammed, which are identified by their dbest accession numbers. For both A and B, class designations are based on sequence homology with yeast subfamily members using BLAST. Putative transmembrane domains are patterned; P-type ATPase consensus regions, with numbers corresponding to those in Fig. 3, are in gray.


