
Figure 5.
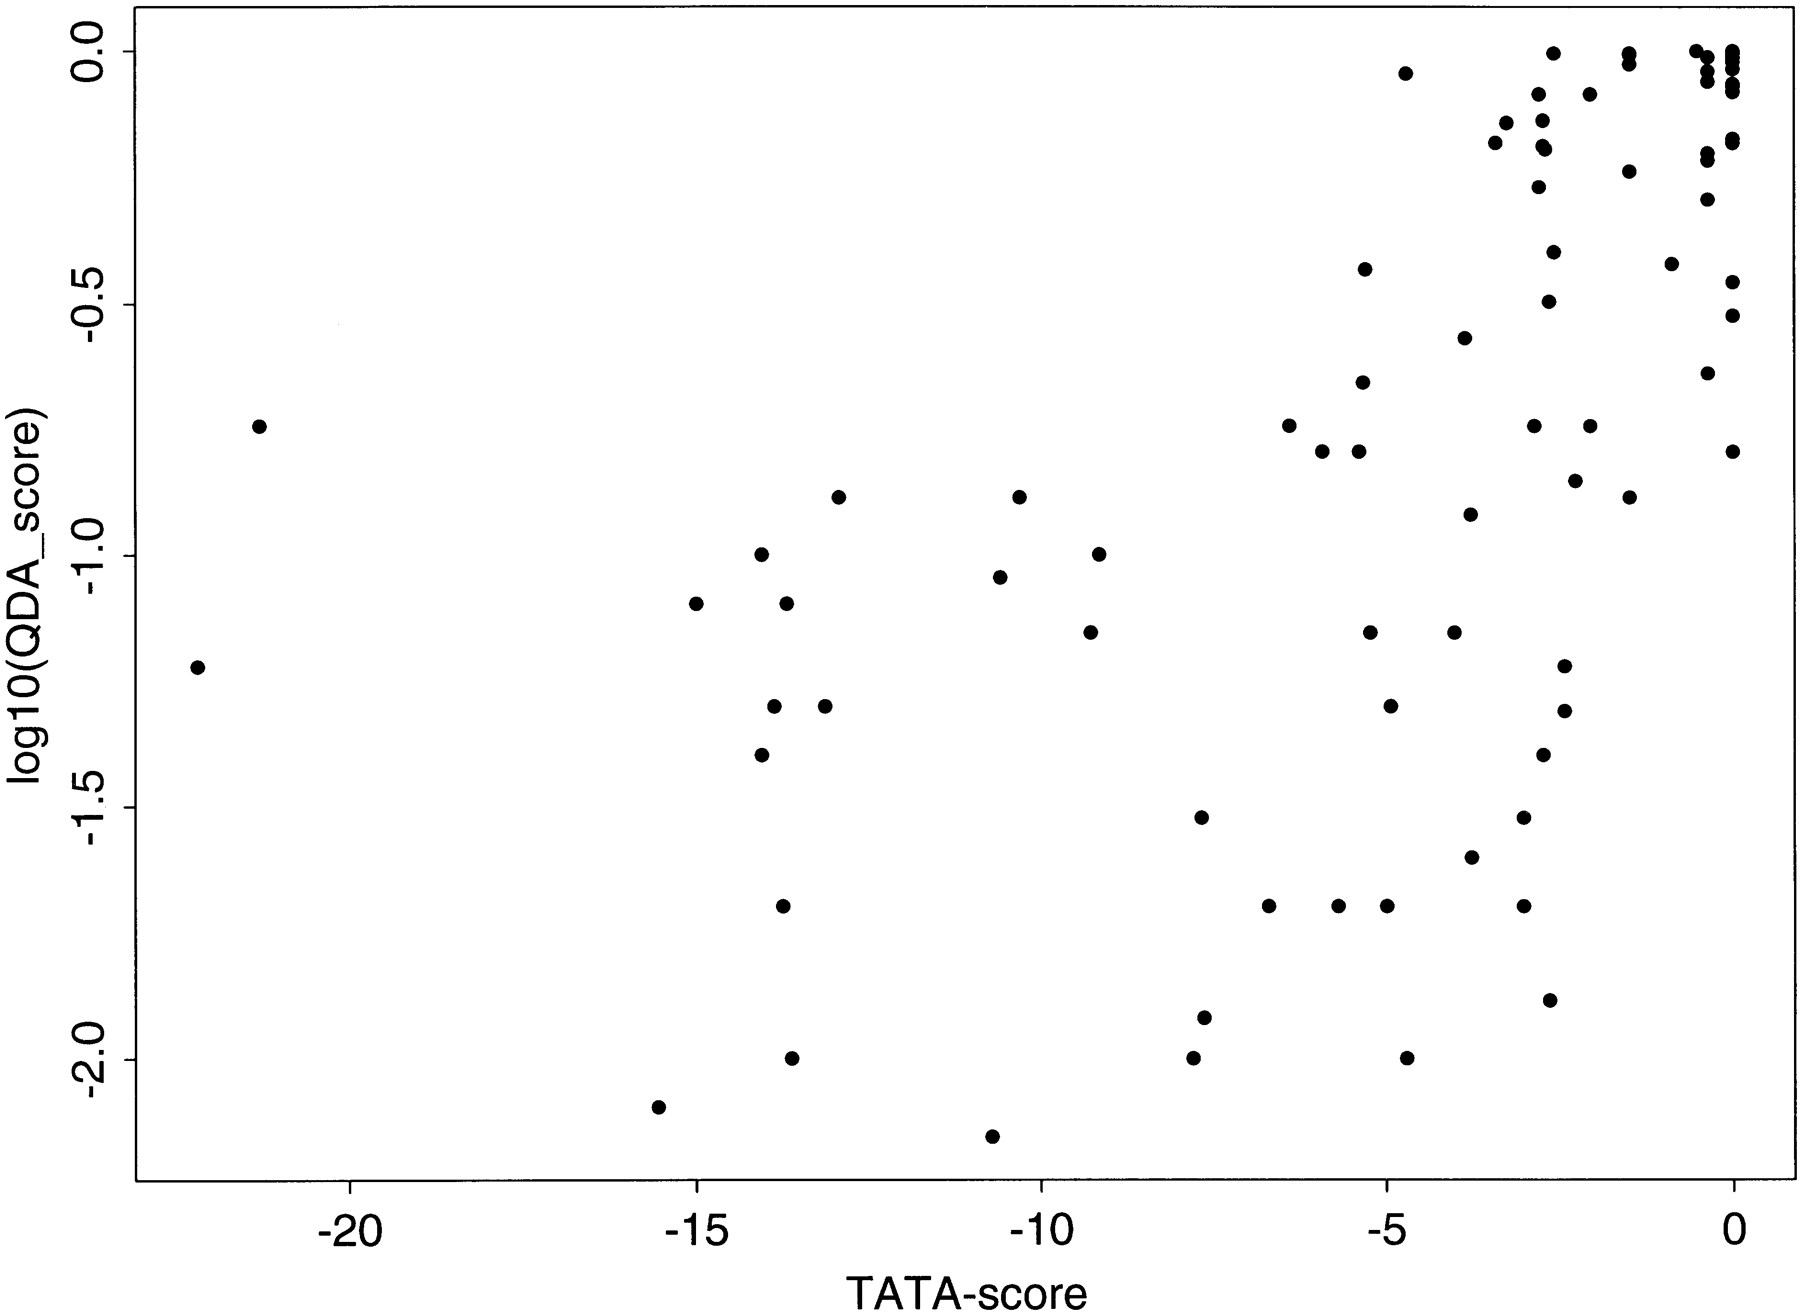
The scatter plot of QDA scores (in log10 scale) for the peaks in (−50, +50) in Fig. 4 vs. the TATA scores (see text for detail).
(Downloading may take up to 30 seconds. If the slide opens in your browser, select File -> Save As to save it.)
Click on image to view larger version.
The scatter plot of QDA scores (in log10 scale) for the peaks in (−50, +50) in Fig. 4 vs. the TATA scores (see text for detail).
 CiteULike
 Delicious
 Digg
Digg Facebook
 Google+
 Reddit
 Twitter
