
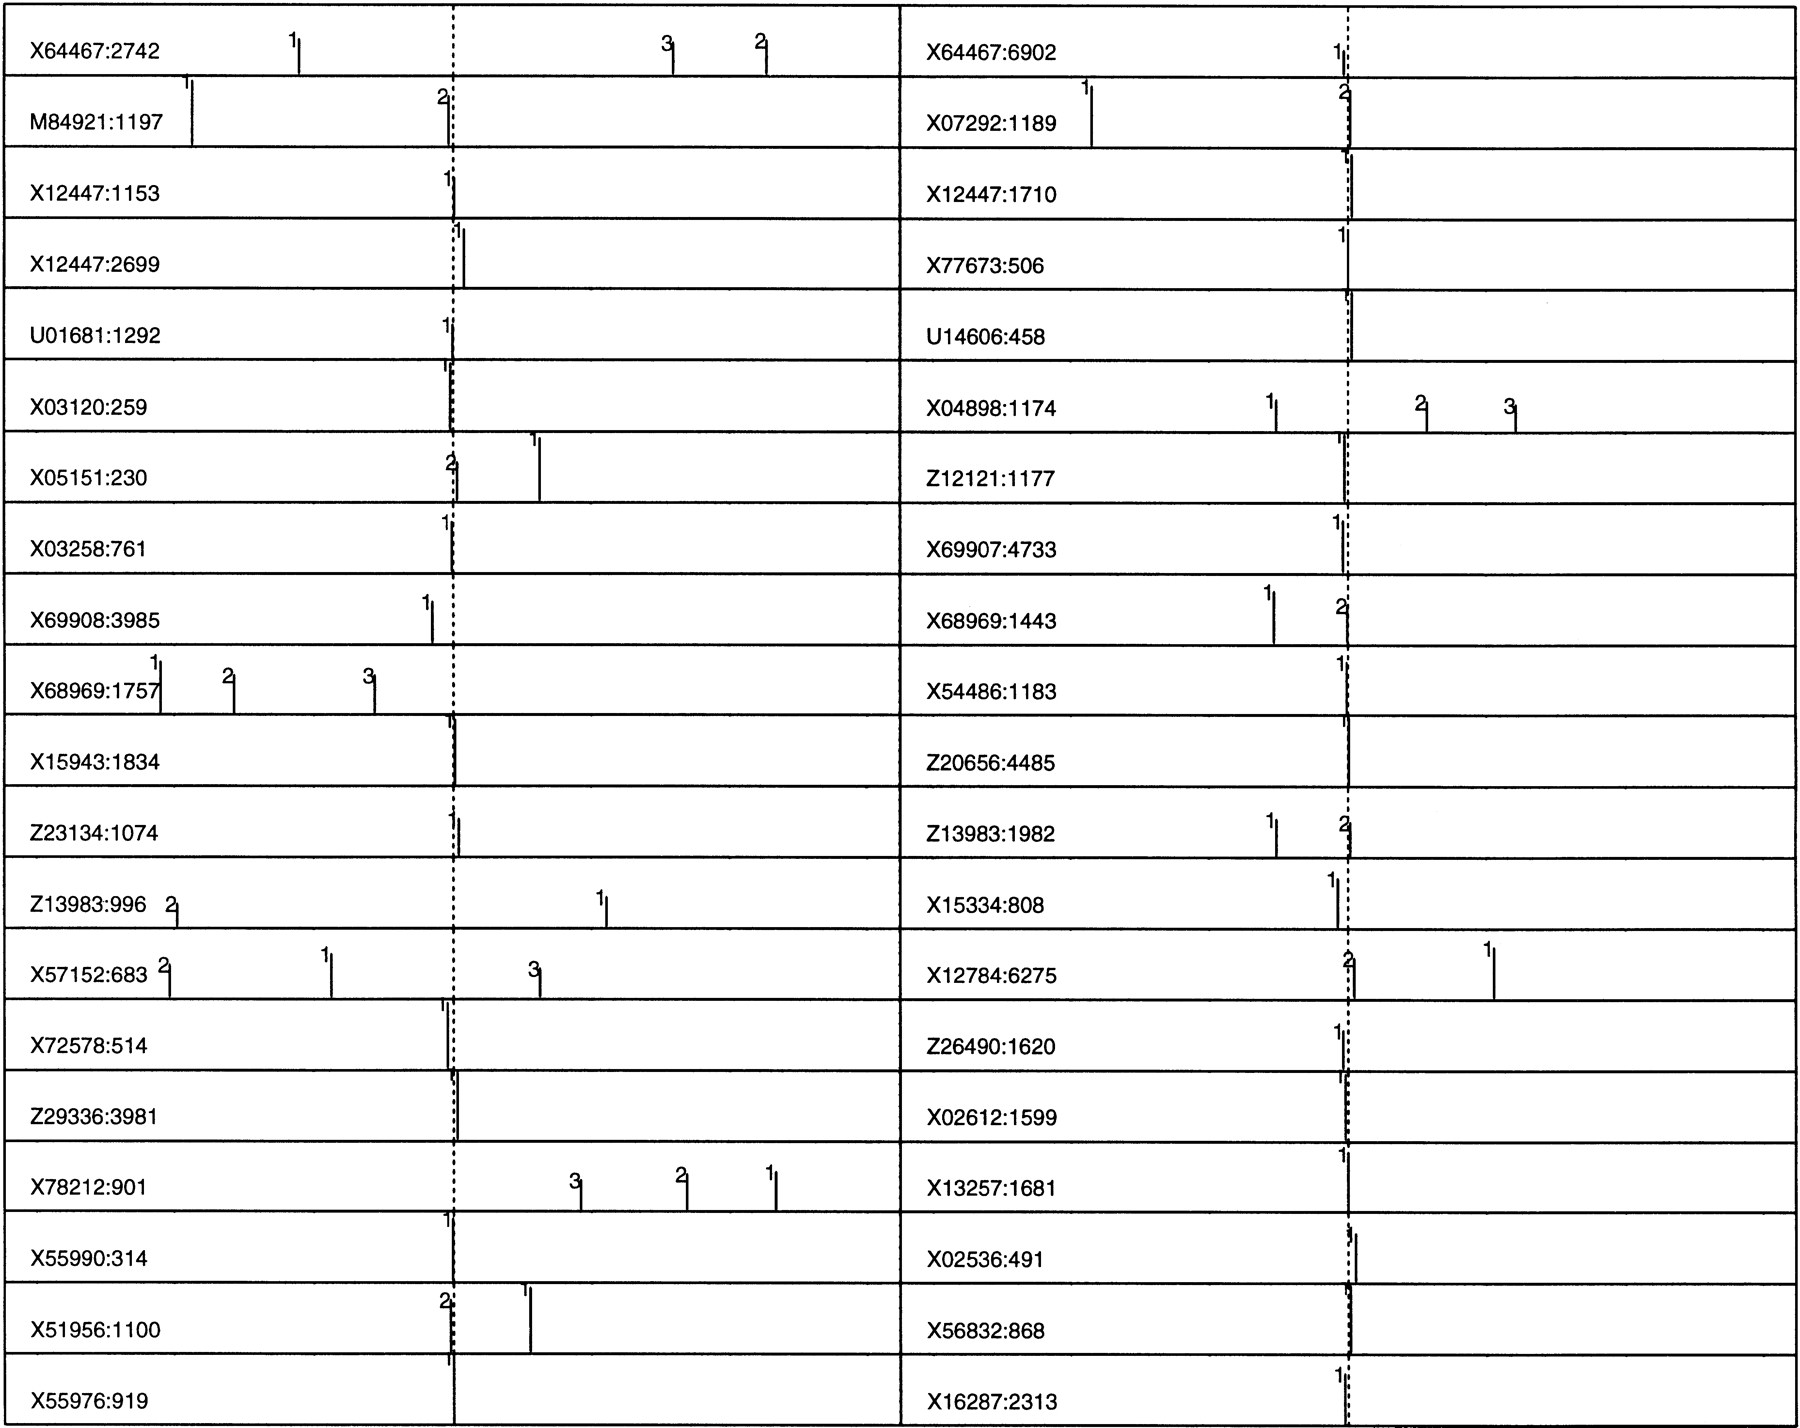
Figure 3.
QDA profiles (in log10 scale) for a newly constructed nonredundant human promoter database LEDB (673 sequences with 55 identical to EPD sequences) were depicted by up to the three highest peaks (see text for details). The GenBank accession no. and the TSS position are indicated at left. Each peak is also indicated by its rank number: (1) the highest peak in the whole profile, (2) the second highest, etc. The sequence range is (−600, +600), and the true TSS position is indicated by a vertical dotted line.


