
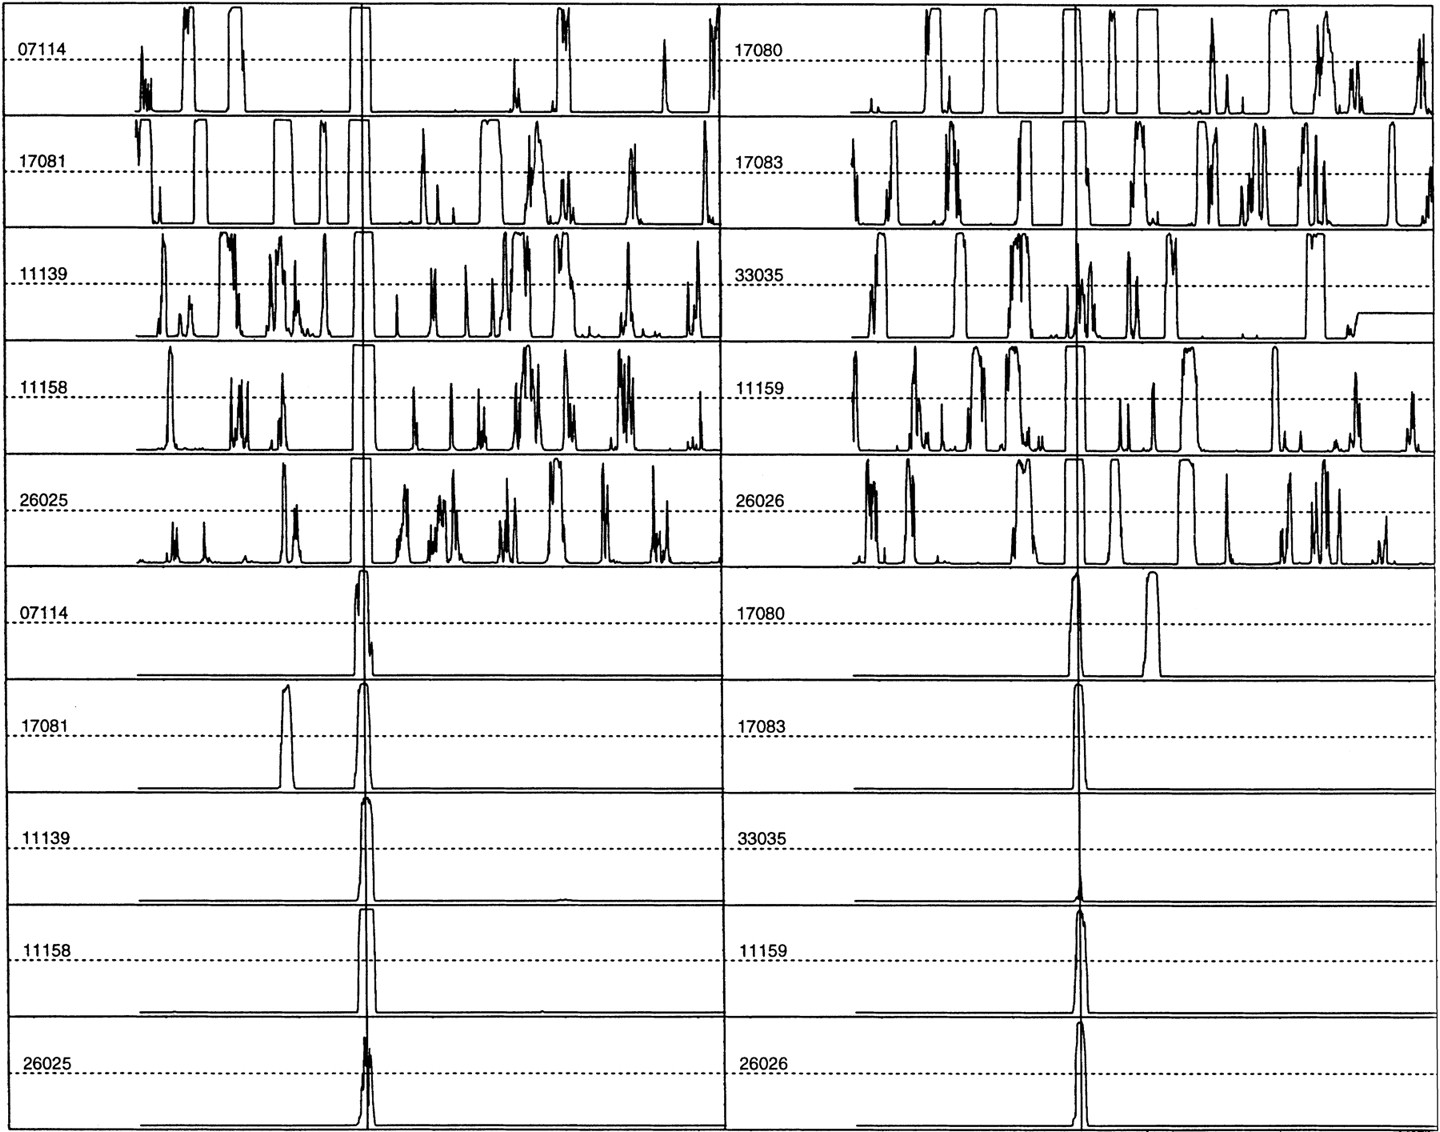
Figure 2.
Top panels are LDA profiles for 10 extended EPD48 human promoter sequences. Bottom panels are QDA profiles for the same 10 sequences. The EPD entry-ID is indicated for each sequence. The vertical lines are the true TSS positions. The sequence range is (−600, +600). A peak in the profile indicates a high likelihood for a TSS.


