
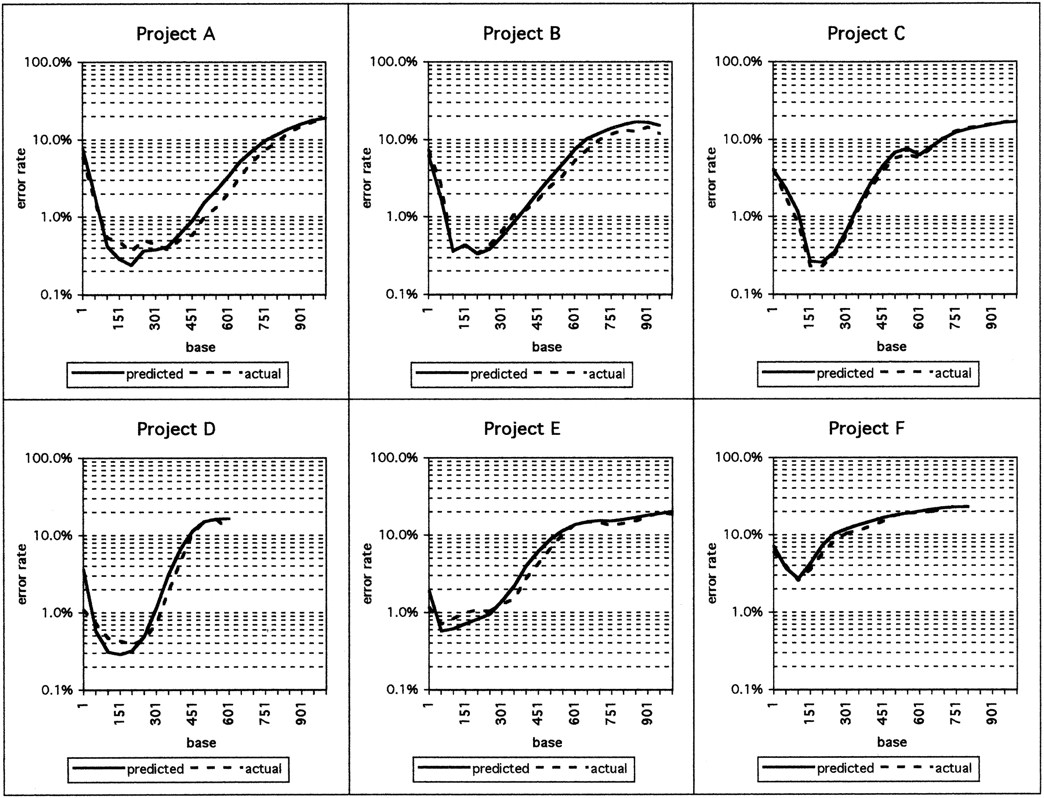
Figure 1.
Actual and predicted error rates in six different sequencing projects. Actual error rates and predicted error rates in 50-base windows over the length of the sequence reads, averaged over all reads that could be aligned to the consensus sequence by CROSS_MATCH, are shown. The numbers on the x-axis show the first base in a given 50-base window.


