
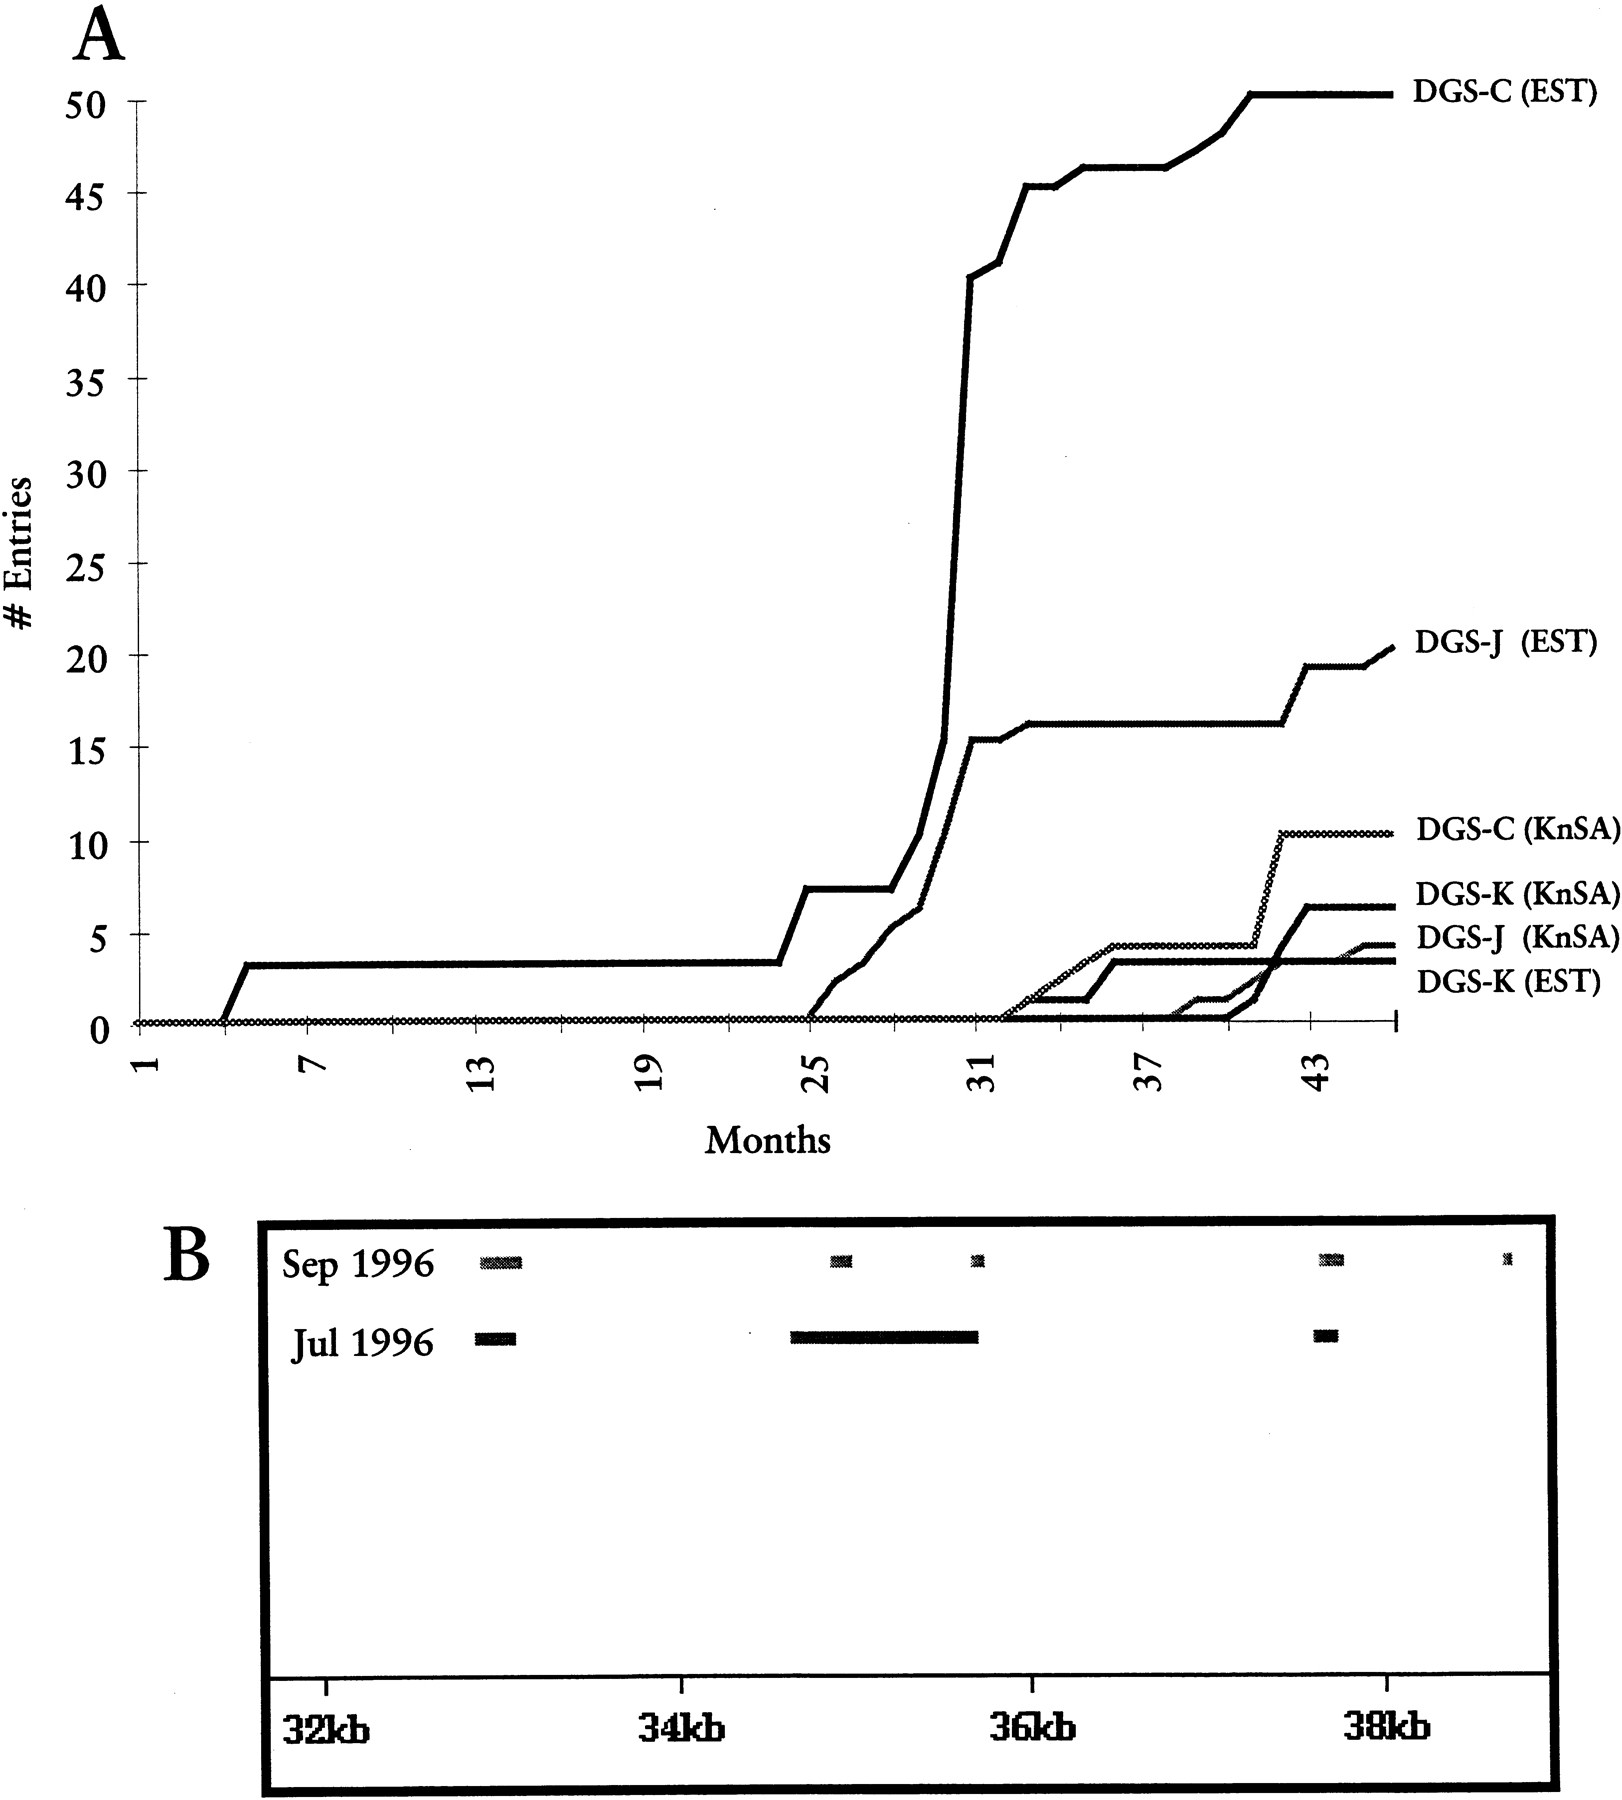
Figure 4.
Change in annotation over time. (A) Accumulation over ∼4 years of alignments from CARTA’s similarity sensors with three benchmark genes in the DiGeorge critical region on human chromosome 22. The y-axis value indicates the number of target database (dbEST or GenBank) entries at a given point in time that met the sensor’s threshold for feature creation. (B) Detail of GRAIL2 annotation in a portion of the DiGeorge critical region at two points in time, showing changes in GRAIL exon predictions.


