
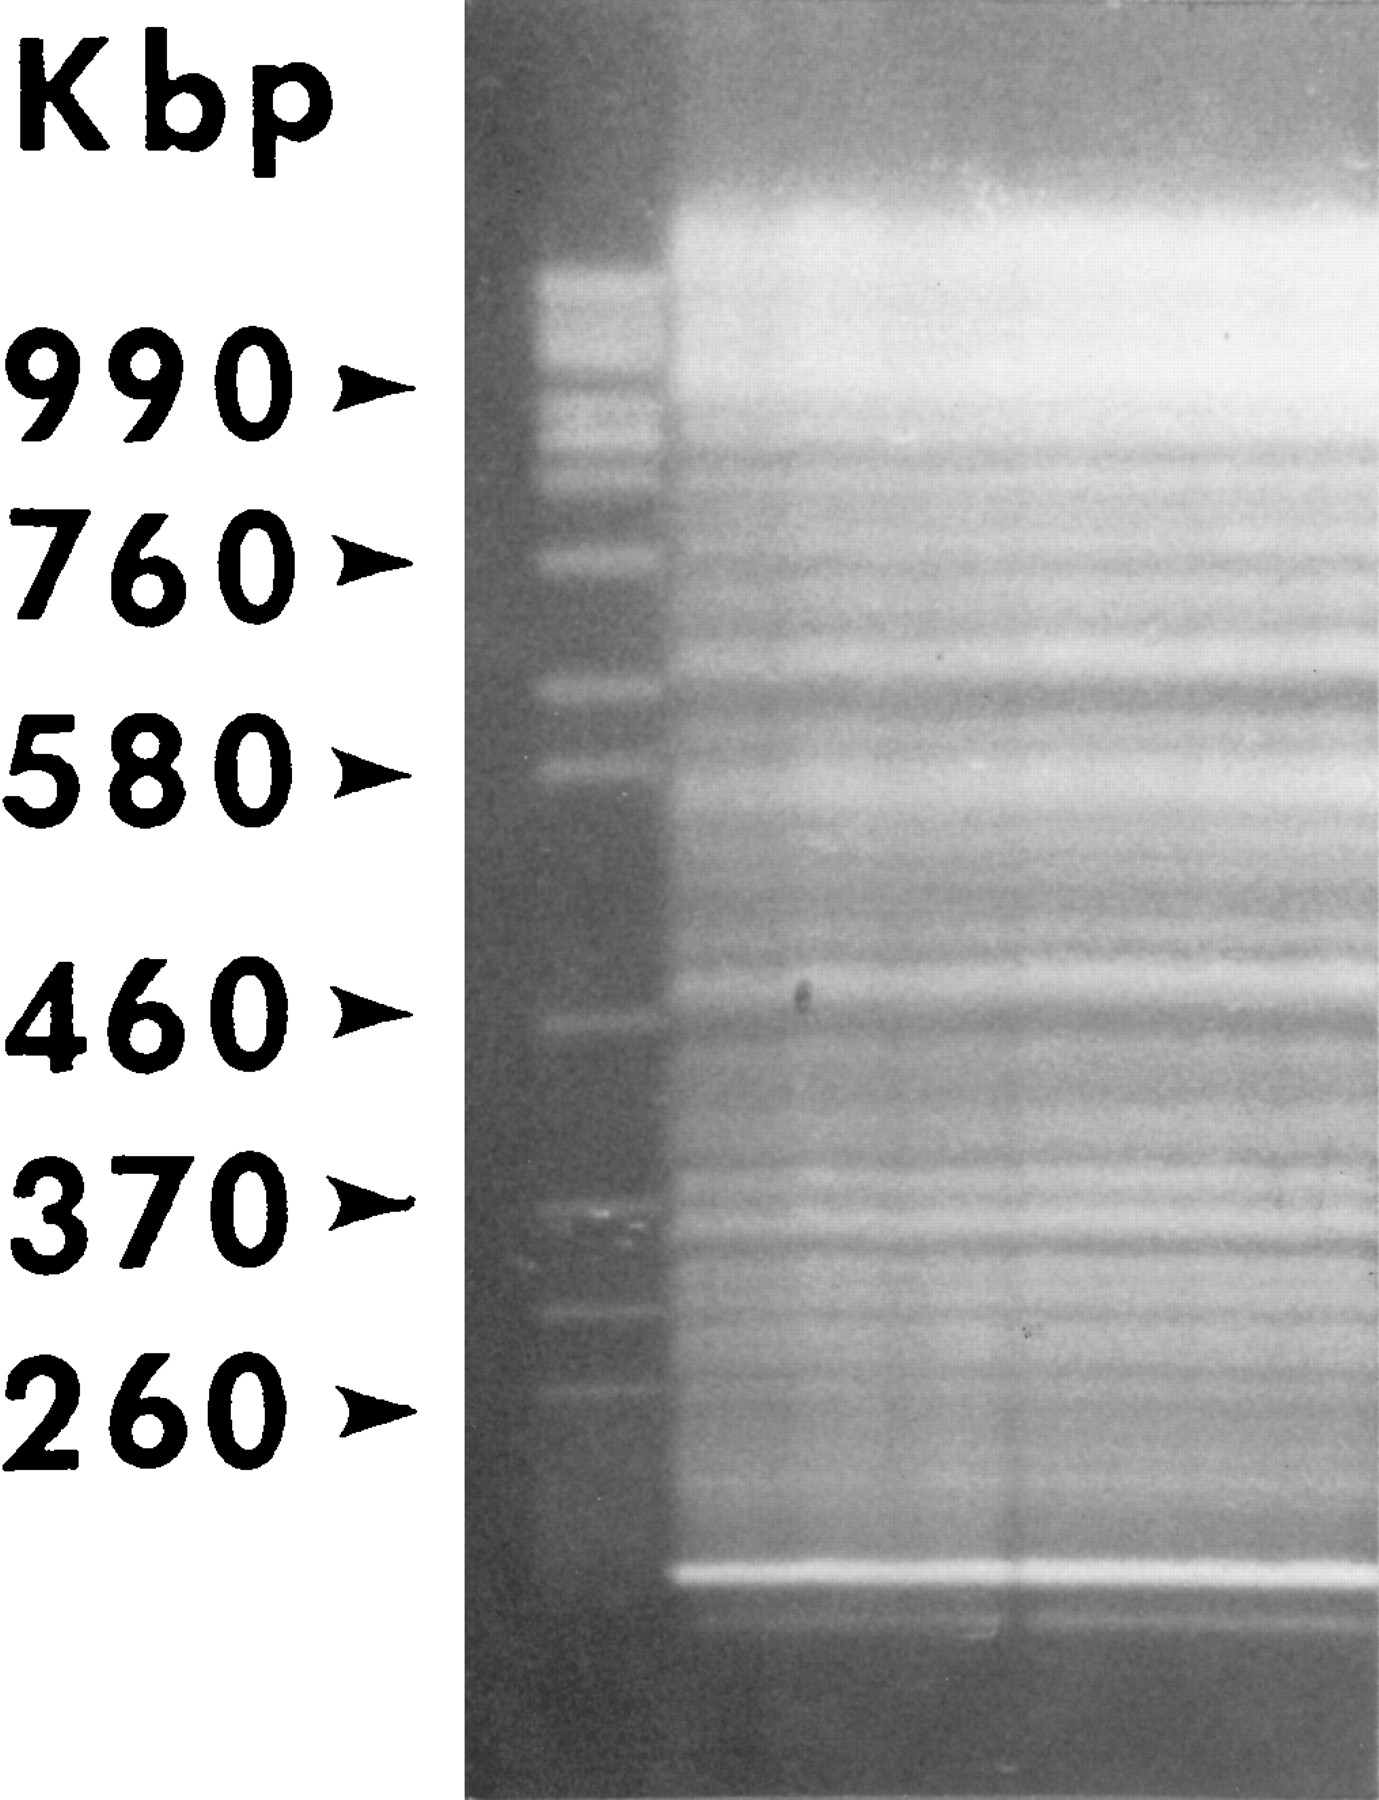
Figure 3.
The fragmented MAC genome of T. thermophila, visualized by pulse-field gel electrophoresis of whole-cell DNA. (Left lane) The chromosomes of Saccharomyces cerevisiae, used as size markers. Brighter bands most likely represent coincidences of unrelated ARPs of the same size, except for the two lowest bands—the mitochondrial and MAC rDNA. MIC DNA stays in the wells under the conditions used.


