
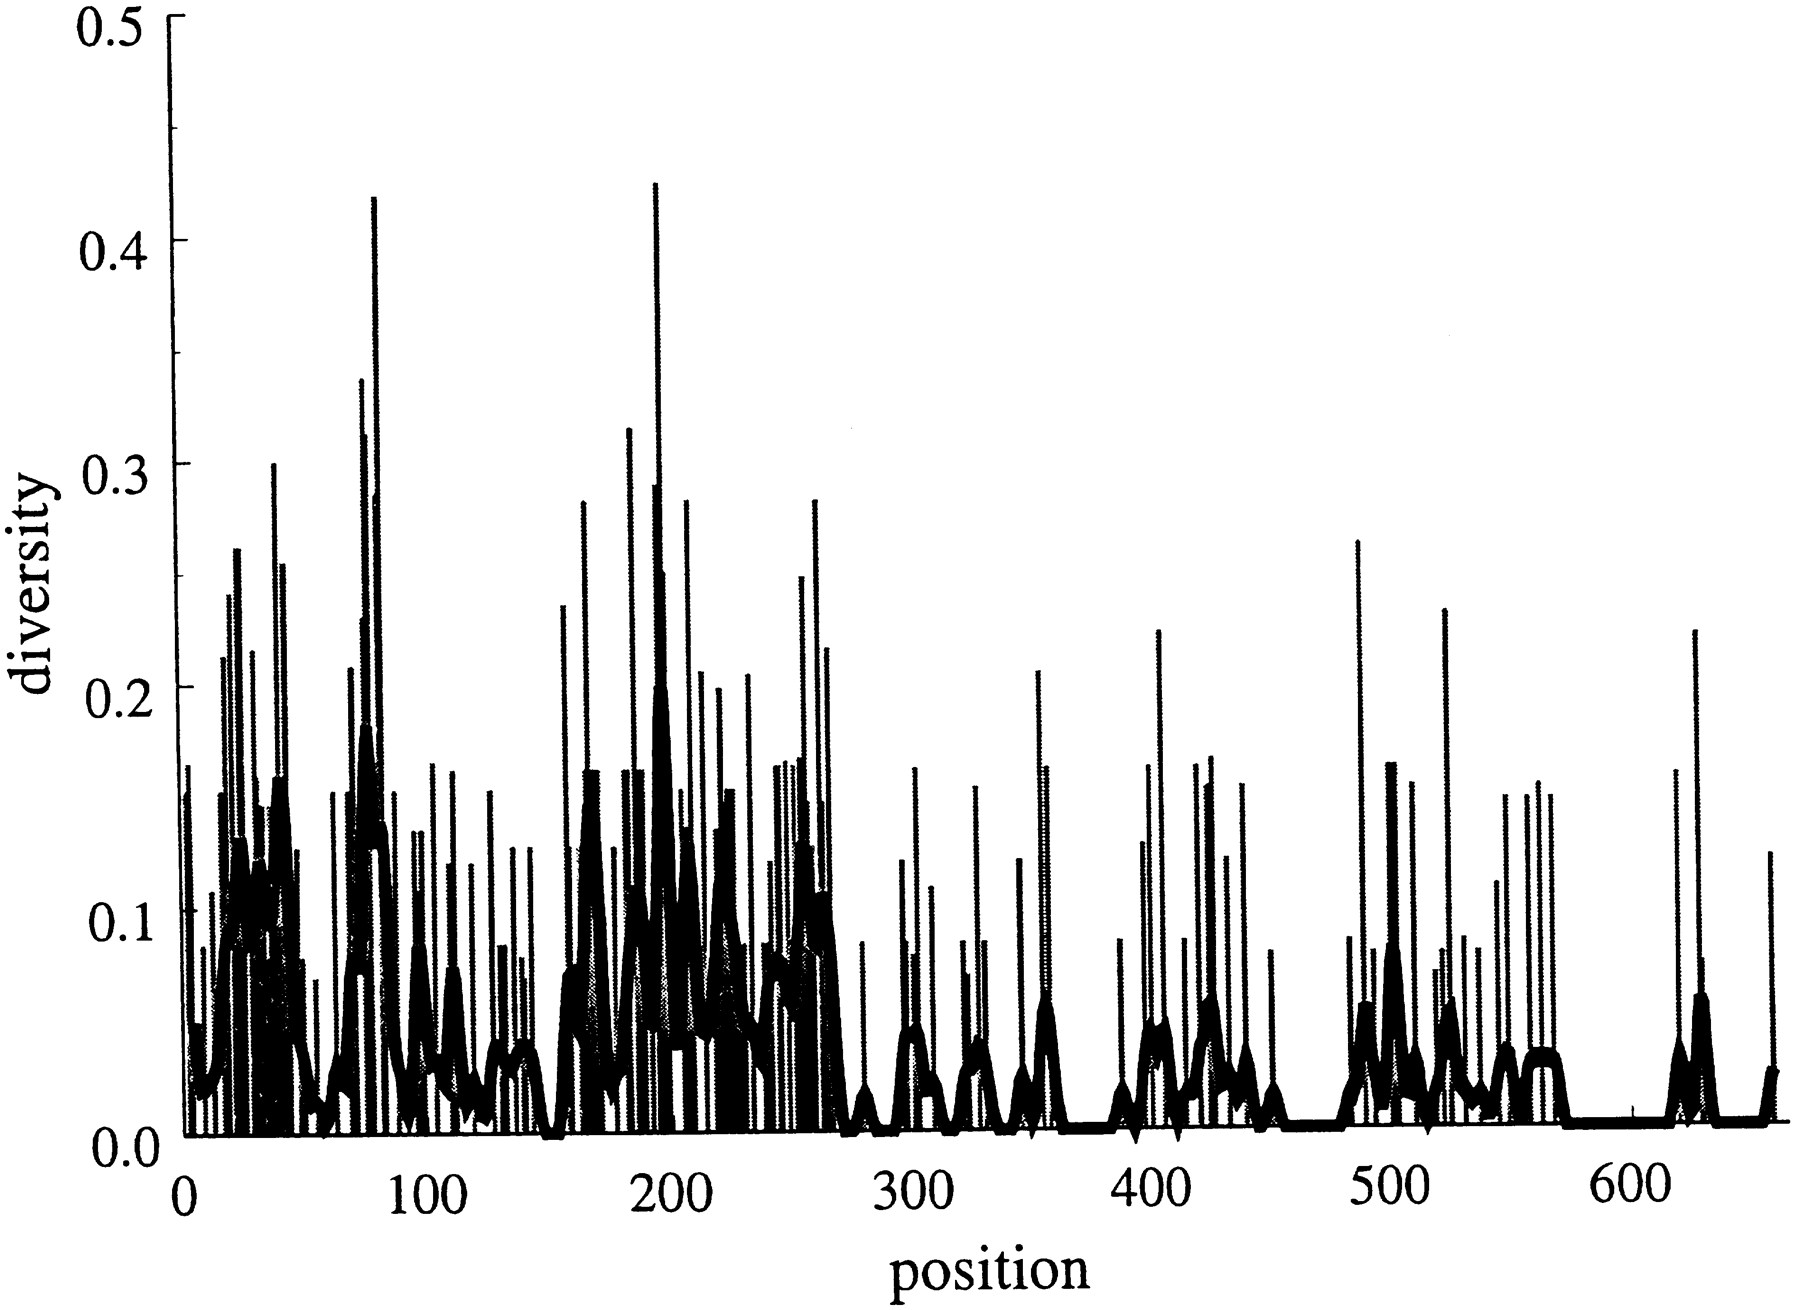
Figure 6.
Diversity over Mus Eβ, Aα, andAβ coding regions. Sequences are 667 bases long. Bars are averages over the three loci. (Other details as in Fig.1.) Note that the ordinate is scaled to show a maximum value of 0.5 rather than 1 as in Figs. 1 F2 F3 F4 F5. The average diversity over all positions for each locus is as follows: Eβ,0.02995; Aα, 0.04143;Aβ, 0.05141.


