
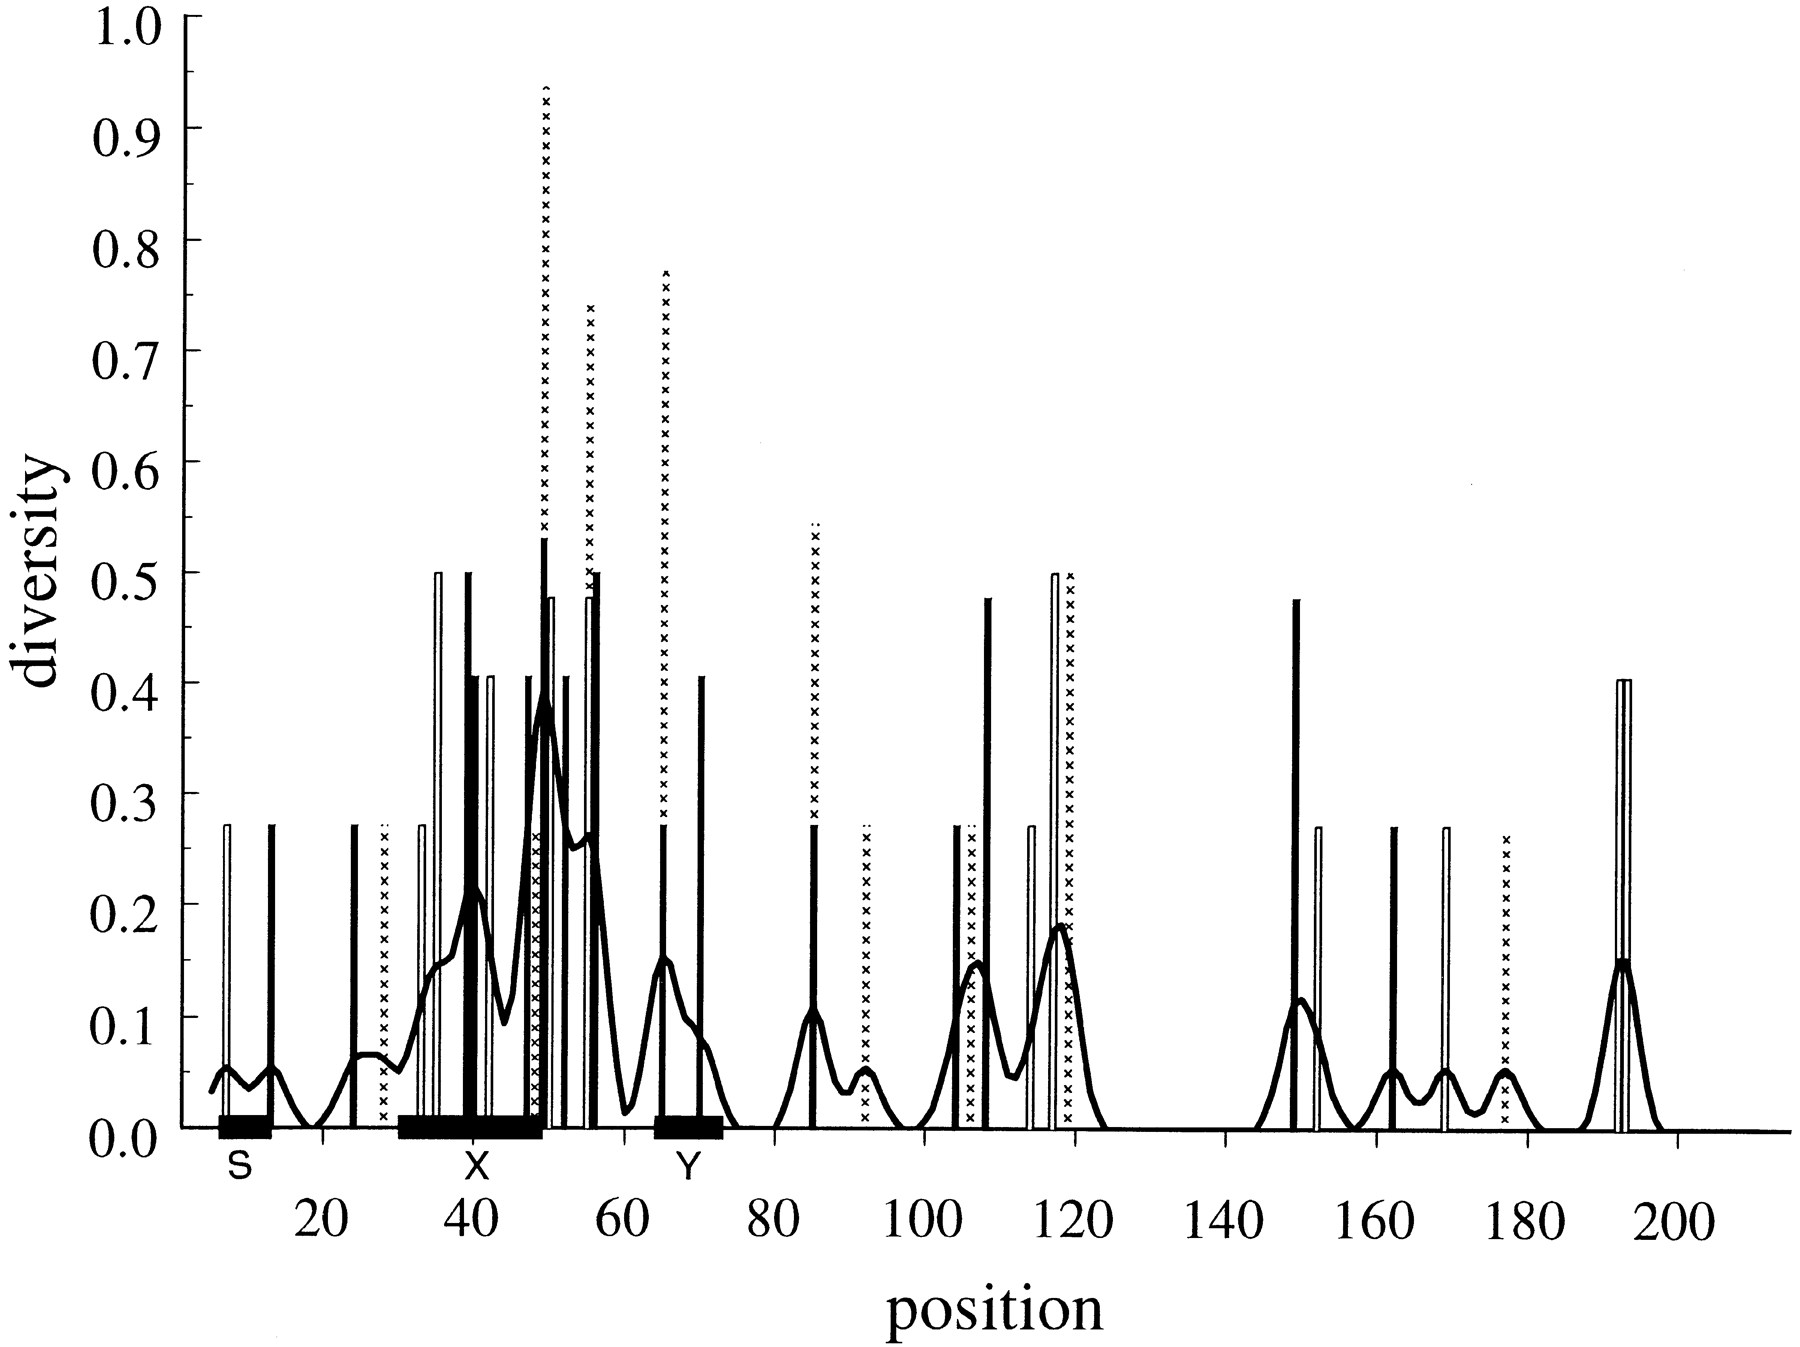
The diversity of the promoter regions measured by the Shannon entropy for the Mus Eβ (open bar),Aα (solid bar), Aβ(hatched bar) loci (shown stacked). Each locus is represented by eight haplotypes. The solid lines are moving averages computed using a Gaussian kernel 2 nucleotides wide. The width of this smoothing kernel is chosen to be the minimum length that produces smoothing sufficient for ease of visual inspection. Small variations in this width do not have an appreciable impact on the appearance of this plot. The locations of the promoter boxes are indicated by heavy lines on the abscissa. Base numbers start 6 nucleotides 5′ of the S box. Sequence lengths are as follows where the last 3 bases form the transcription start site ATG: Eβ, 215 bases; Aα, 174 bases; Aβ, 199 bases.


