
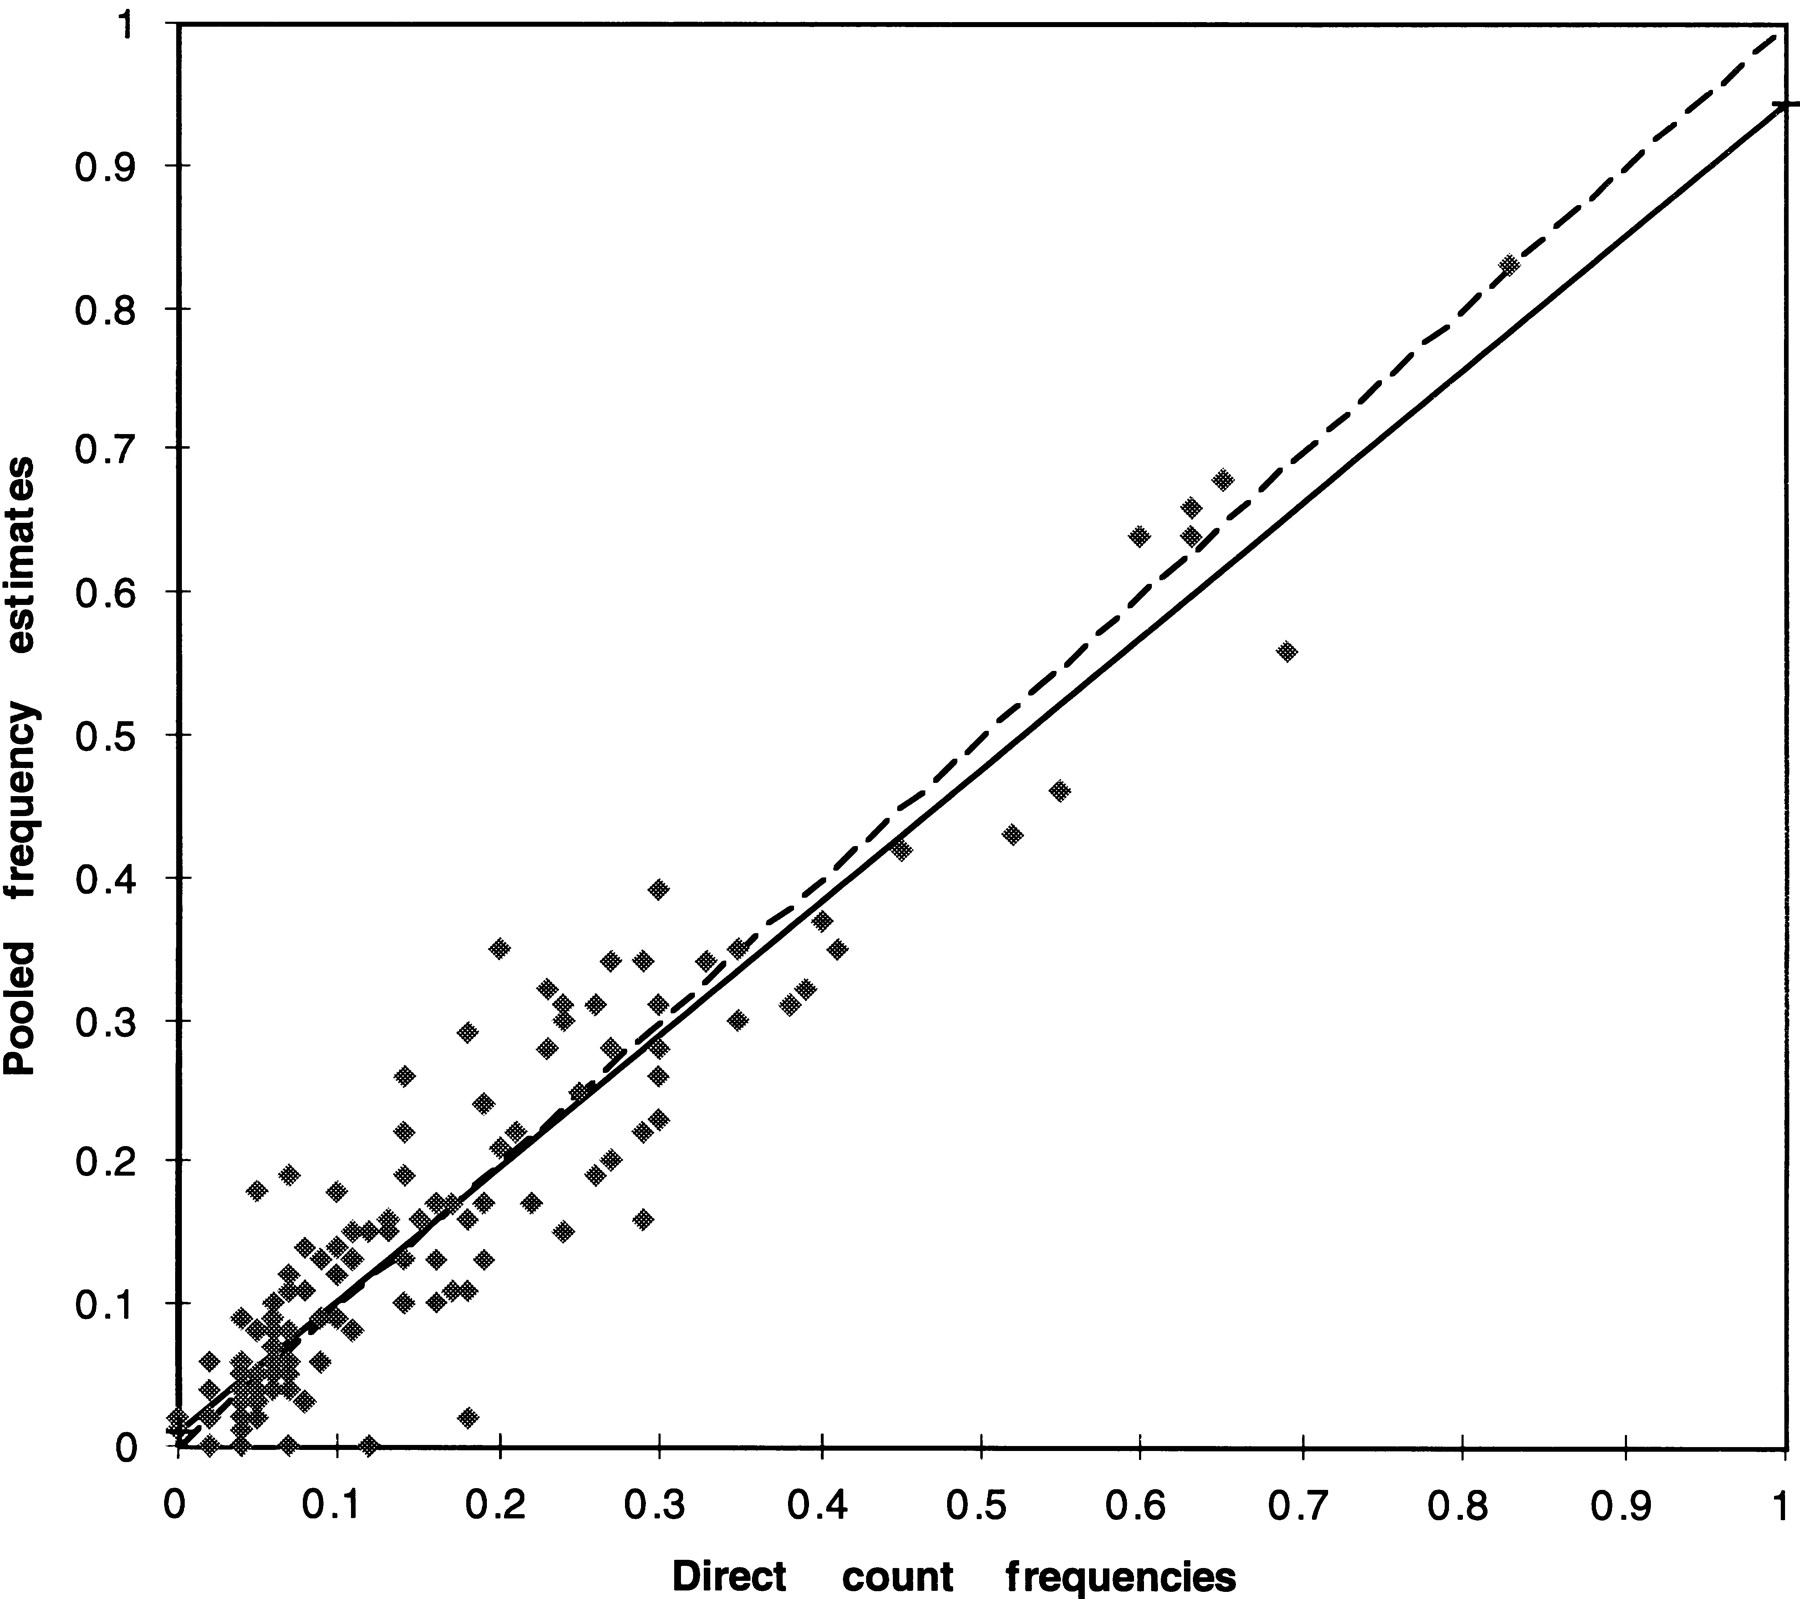
Figure 6.
The relationship between pooled and direct allele frequencies. They-axis shows the allele frequency estimate from a DNA pool, and the x-axis that from direct genotyping. The data are 131 alleles from all T and U chromosomes compared at the tetranucleotide markers in the Mennonites. The solid and the broken lines show the fitted linear regression and the line expected from perfect agreement, respectively.


