
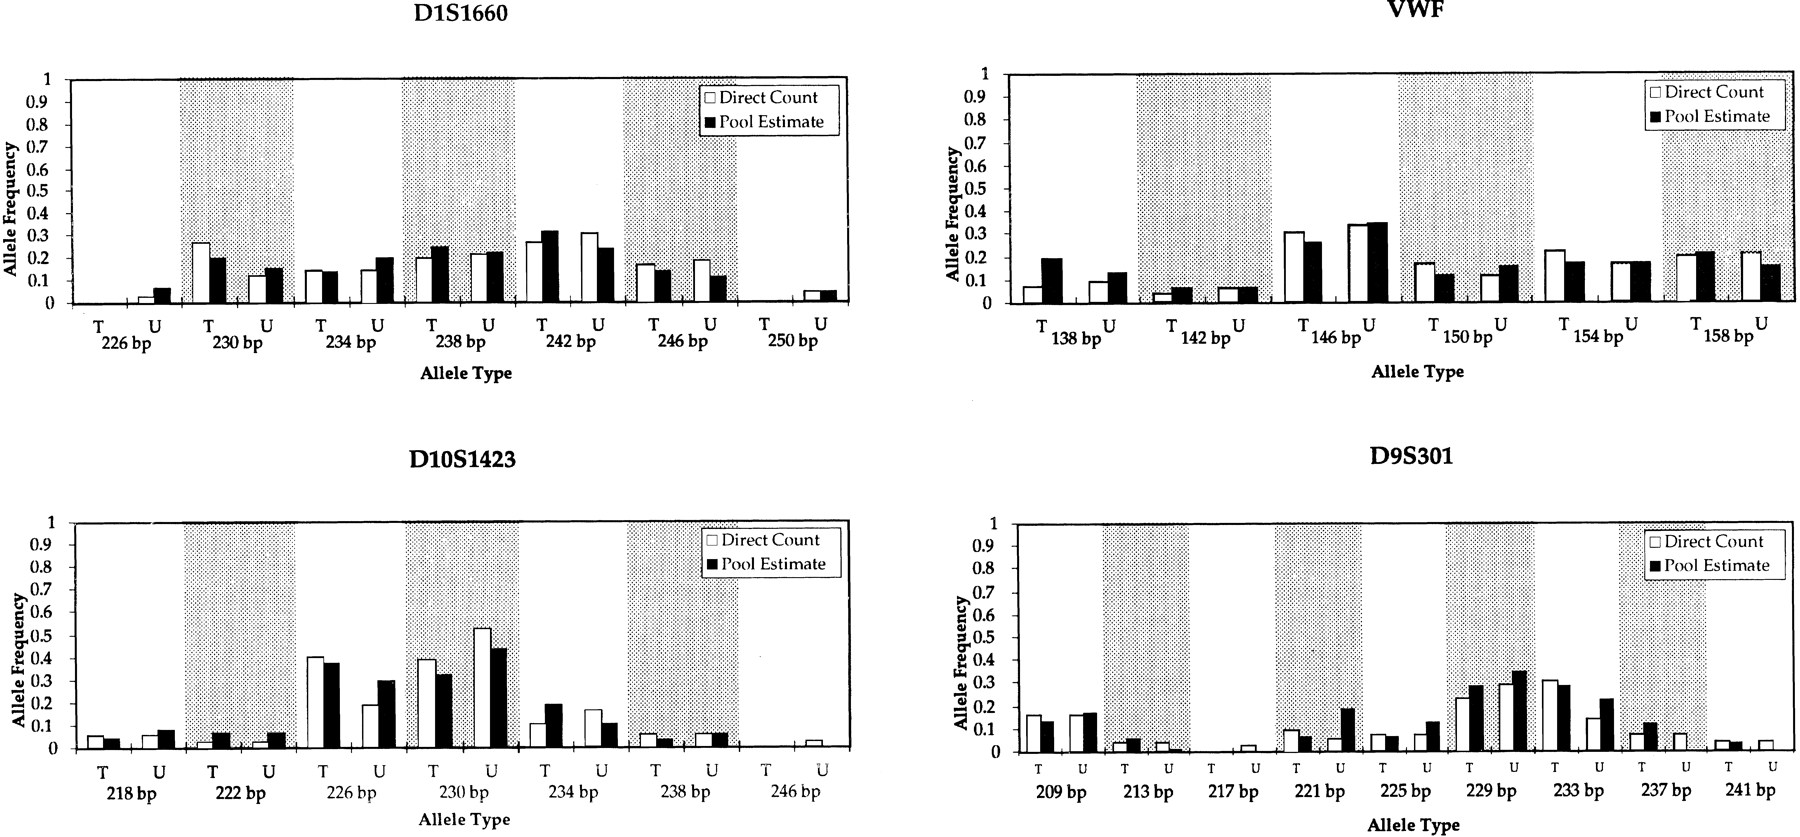
Figure 5.
DNA pooling of HSCR control genetic markers. T and U parental allele frequencies determined from direct genotyping, estimated from two DNA pools (27 HSCR affected offspring and their parents) for control markers not linked to the HSCR susceptibility gene. For visual clarity, white and shaded stripes have been used to separate T and U frequencies on adjacent alleles. The legend follows that in Fig. 2.


