
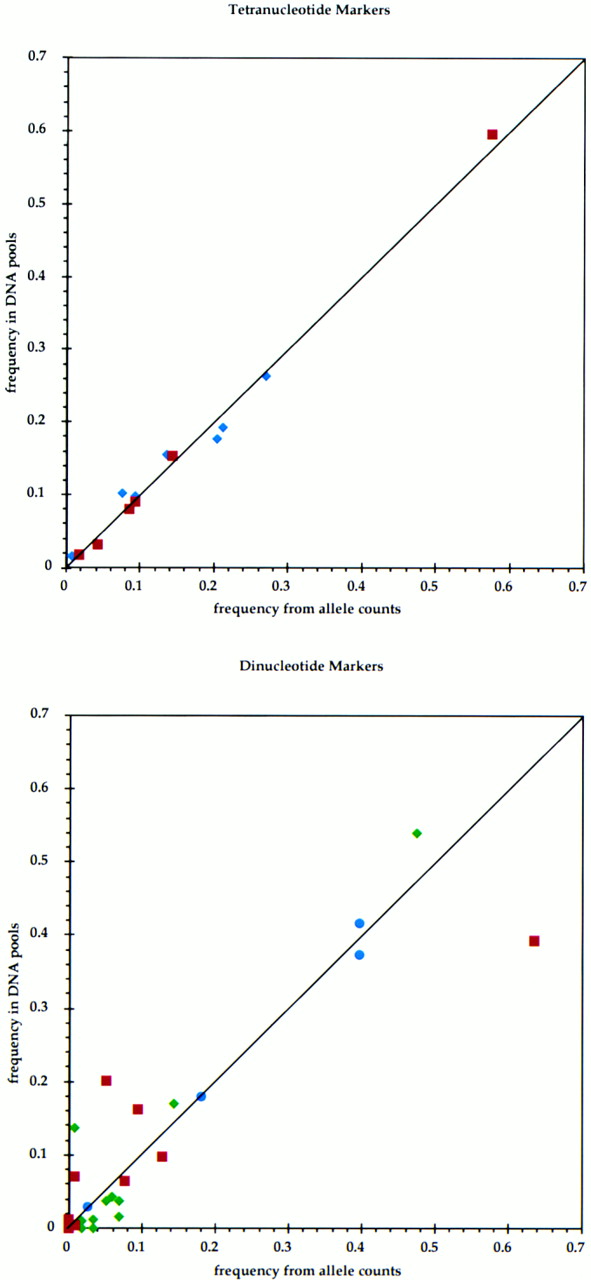
Figure 1.
Accuracy of allele frequencies estimated from DNA pools. Allele frequencies were estimated from relative peak heights from the ABI 377 fluorescence chromatograms (frequency in DNA pools: y-axis values are averages of 10 replicates) and compared with allele frequencies estimated from genotyping individual samples (frequency from allele counts: x-axis). These data, from two tetranucleotide repeat markers, VWF (blue diamonds) and D13S317 (red squares) (left), and three dinucleotide repeat markers, D13S160 (red squares), D13S170 (green diamonds), and D13S281 (blue circles) (right), were obtained by studying 76 unrelated samples (parents) in CEPH.


