
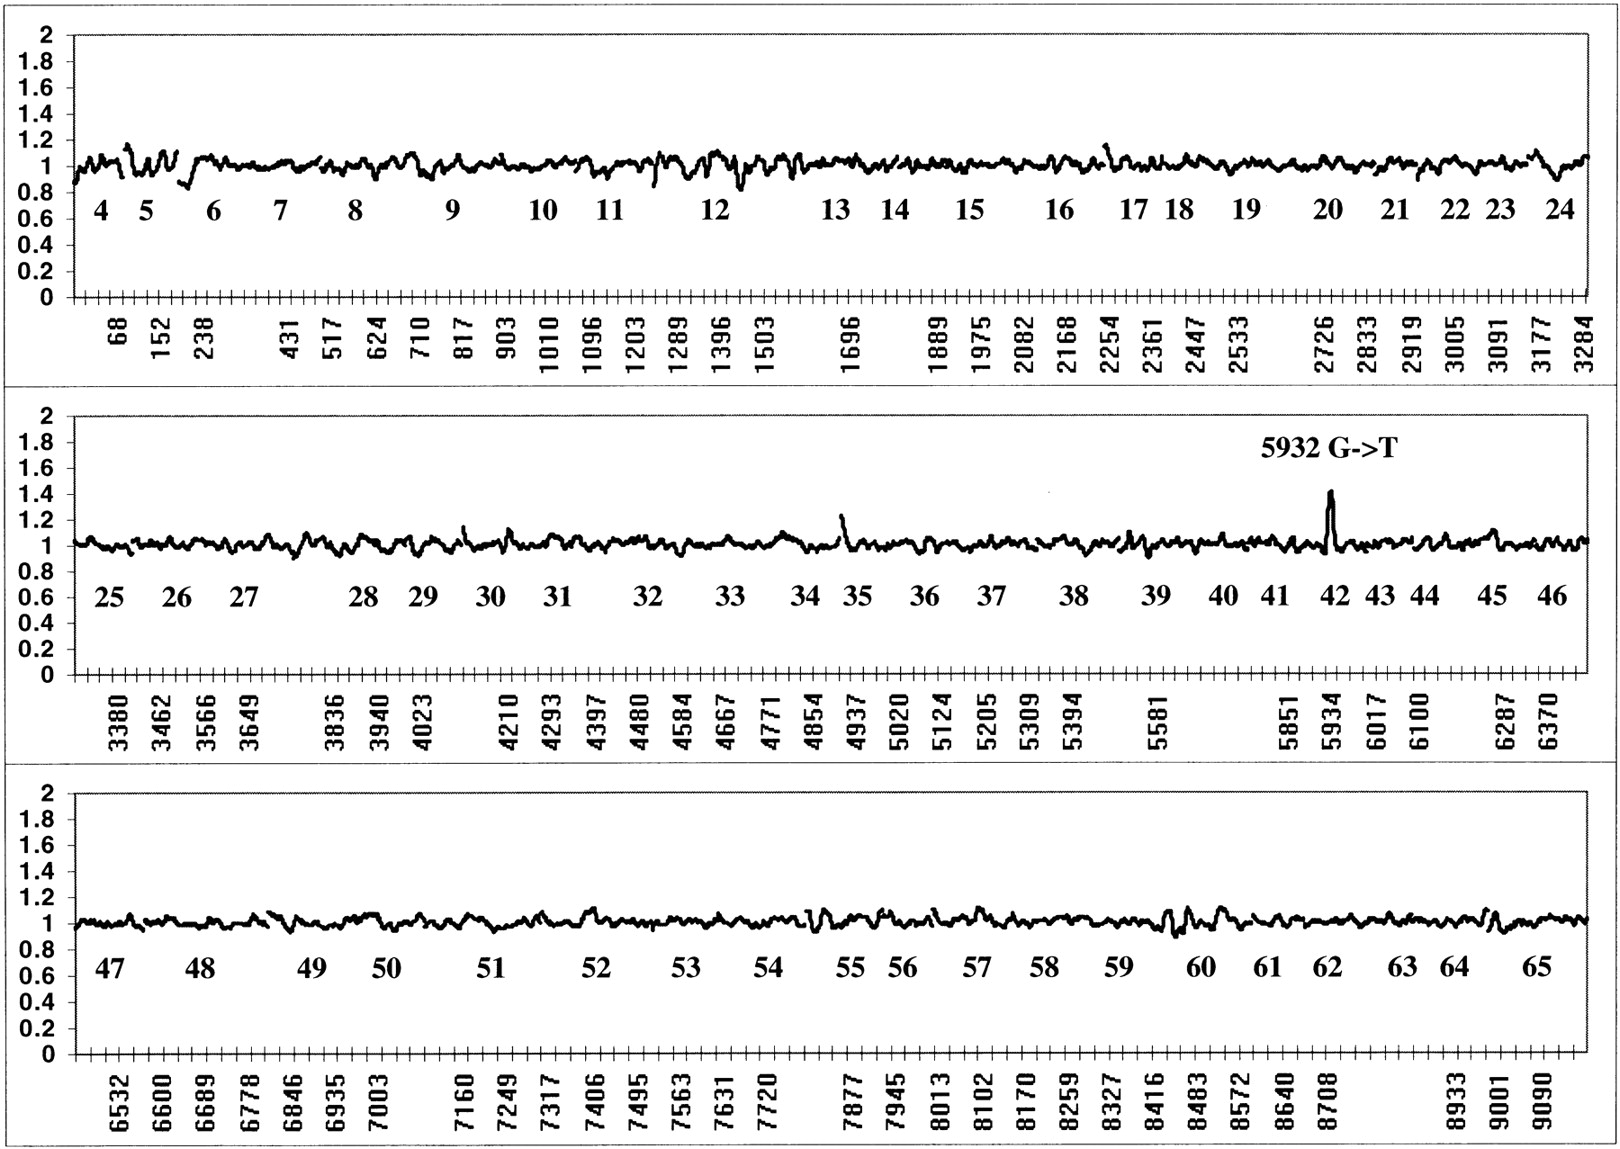
Two-color loss of signal assay for a nonsense mutation. Fluorescein-labeled (green) reference and biotinylated (red) test GMO8388 targets were cohybridized to the array. To correct for reproducible differences in the hybridization efficiencies of reference and test targets, the ratio of fluorescein to phycoerythrin signal at each wild-type position was normalized against ratios derived from 10 separate chip cohybridization experiments as described in Methods. Averaged sense and antisense strand ratios from GMO8388 are shown with the identity of each exon listed below the appropriate data points. The labeled peak at the mutated 5932 G/T position (a nonsense mutation) is present on both strands.


