
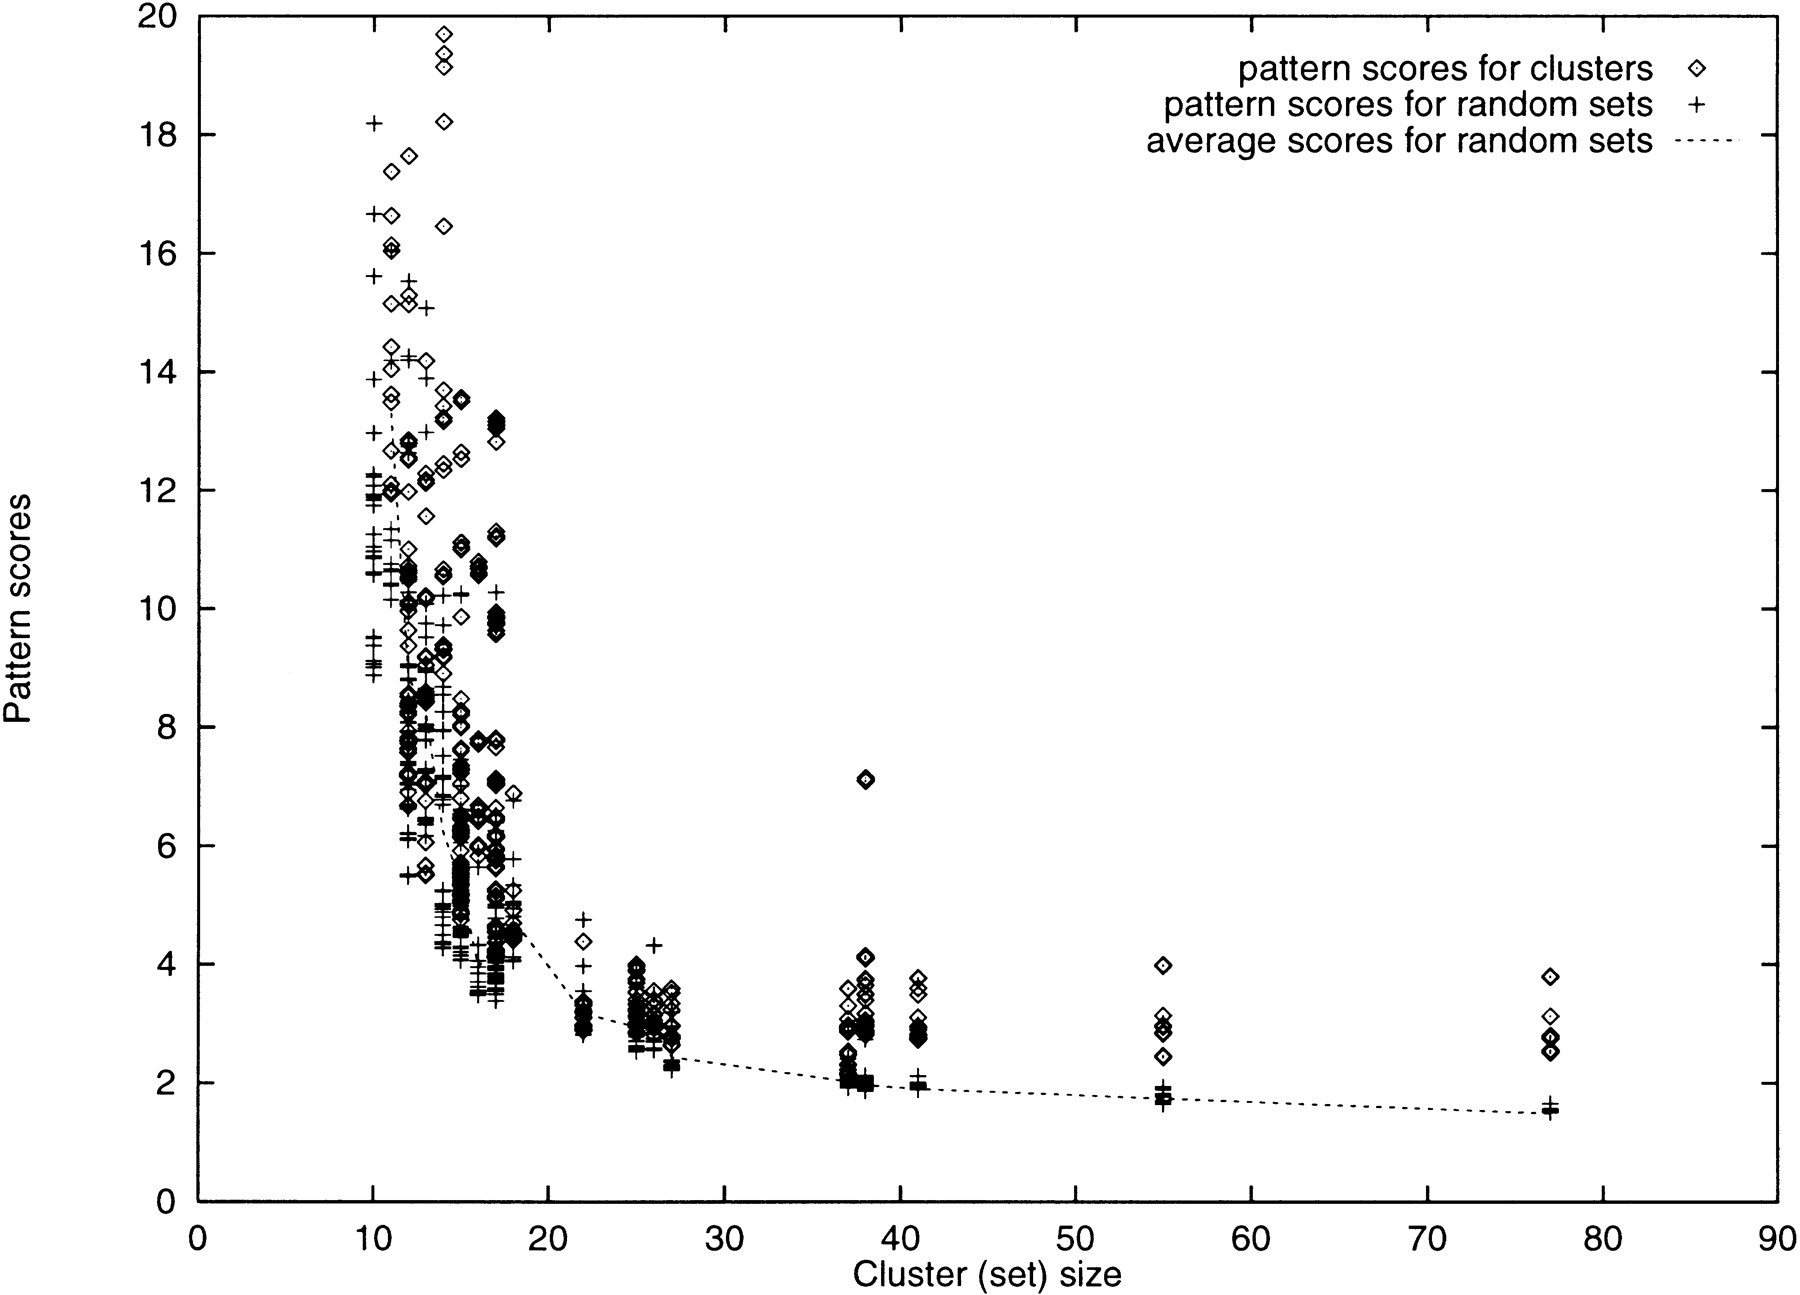
Figure 2.
The plots of the scores of the 30 best patterns found from the clusters of upstream sequences from genes with similar expression profiles and of random sets of the upstream sequences of the same size. The dotted line is the average score of the 30 best patterns found from the random sets of the respective sizes. For the sets of 30 sequences and more, the pattern scores from the random sets of the upstream sequences are stabilizing and are considerably lower than for 30 best pattern scores for the respective clusters.


