
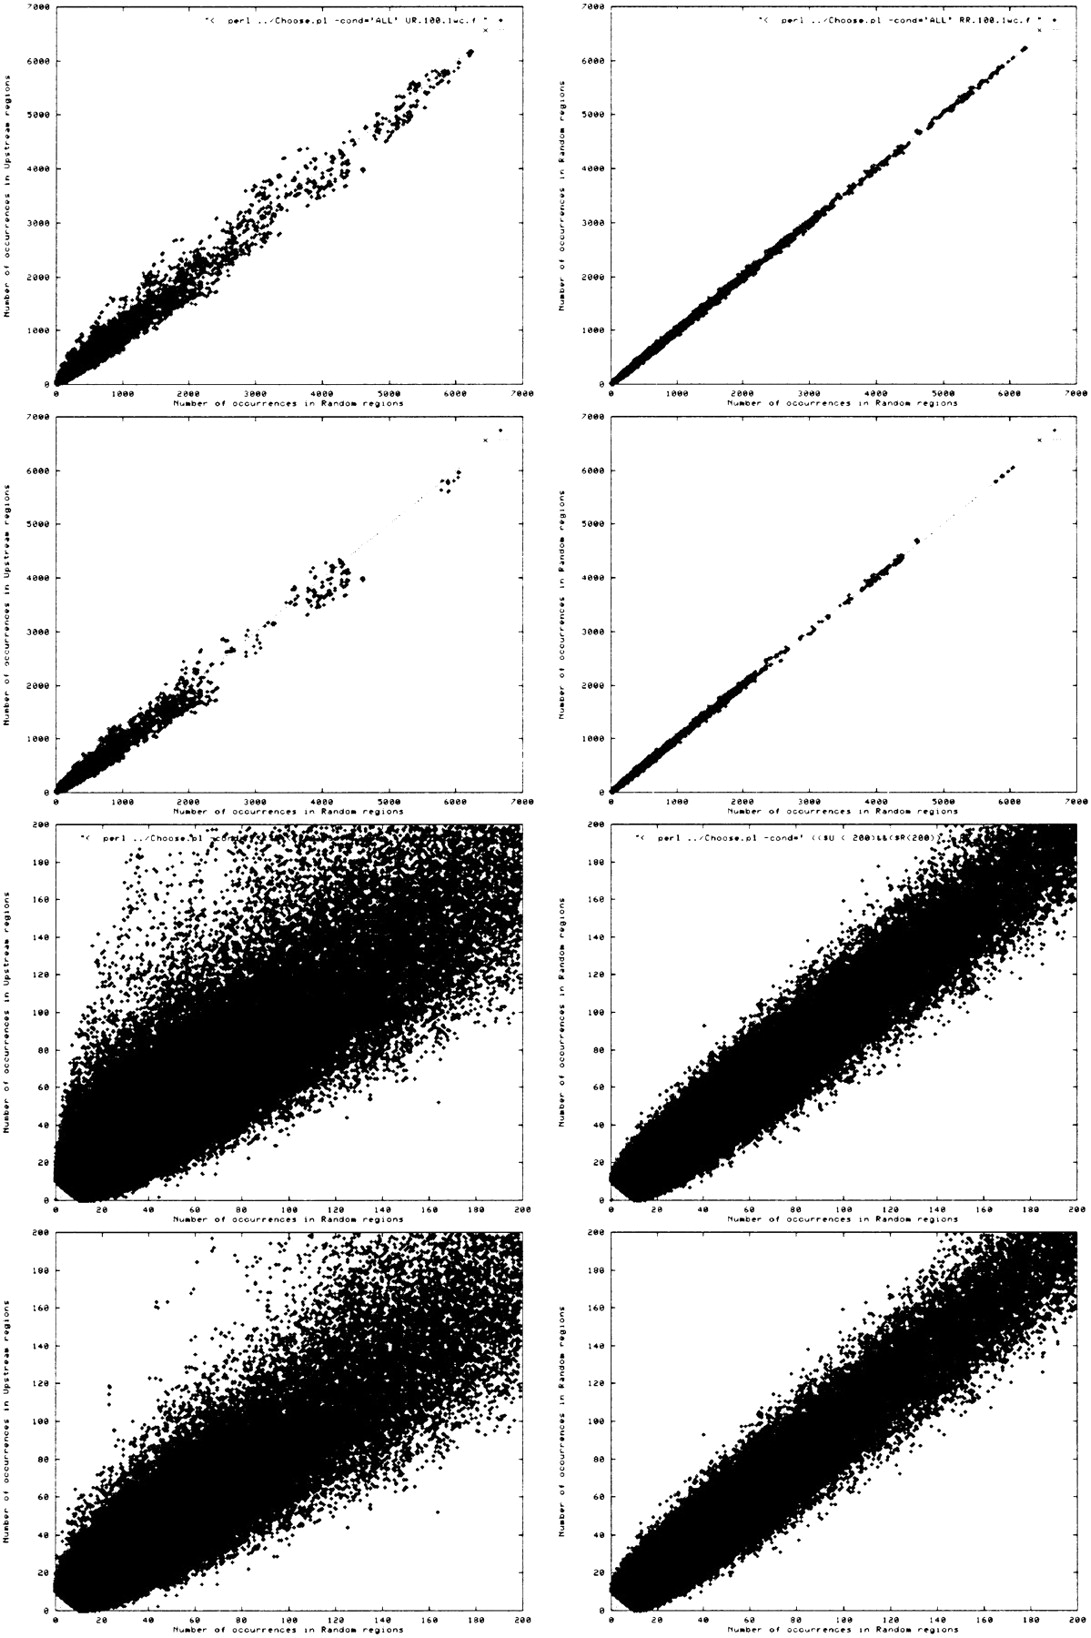
The distribution of all patterns (of unrestricted length) with at most one wild-card symbol in the regions −250 to −150 (upstream from the ORFs) and randomly chosen genomic regions of length 100 bp. Dots in graphs in the left correspond to patterns that occur inx sequences from the random regions (along horizontal axis) and y sequences from the upstream regions (vertical axis). In graphs on the right, the upstream regions are replaced by another set of random regions; therefore, these plots show the expected statistics if the regions are chosen at random. (Top row) All patterns with at least 10 occurrences. (Second row) Subset of top row with all patterns containing at least two characters C or G and not containing any of the substrings AAAA, TTTT, ATAT, or TATA. (Bottom two rows) Same plots as in the first two rows, but only including patterns with at most 200 occurrences in upstream or random regions (i.e., zoomed to the lower left corner).


