
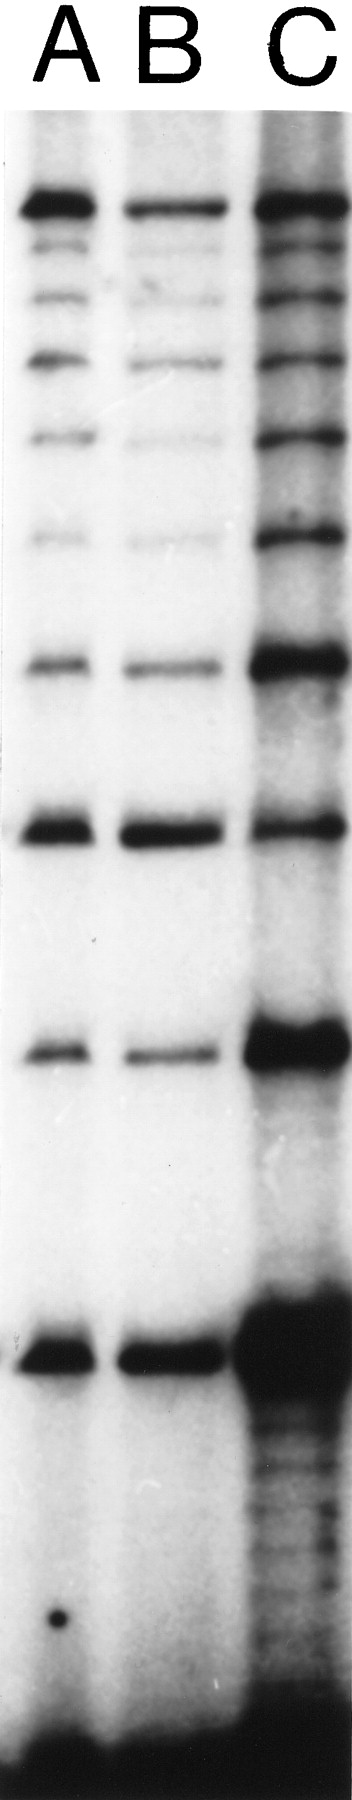
Results of RED performed on DNA from cell line GM 10 850. (A) A sample from the RED protocol used prior to improvement. (B) A standardized RED sample, i.e., a batch of pooled runs of the RED protocol used in A, see under Quantitation. Because of evaporation, the amount of sample applied to the electrophoresis gel was slightly smaller for individual runs (A) than for pooled runs. Thus the amount of product is slightly higher in lane B. (C) A RED sample from the new protocol predicted to give a higher yield. It included a low annealing/ligation temperature (72°C), higher Ampligase concentration (29 units), and was cycled cycled 950 times. We observed a 3.2-fold higher yield of the 360-nucleotide band than an average RED run with the protocol ofSchalling and coworkers (1993).


