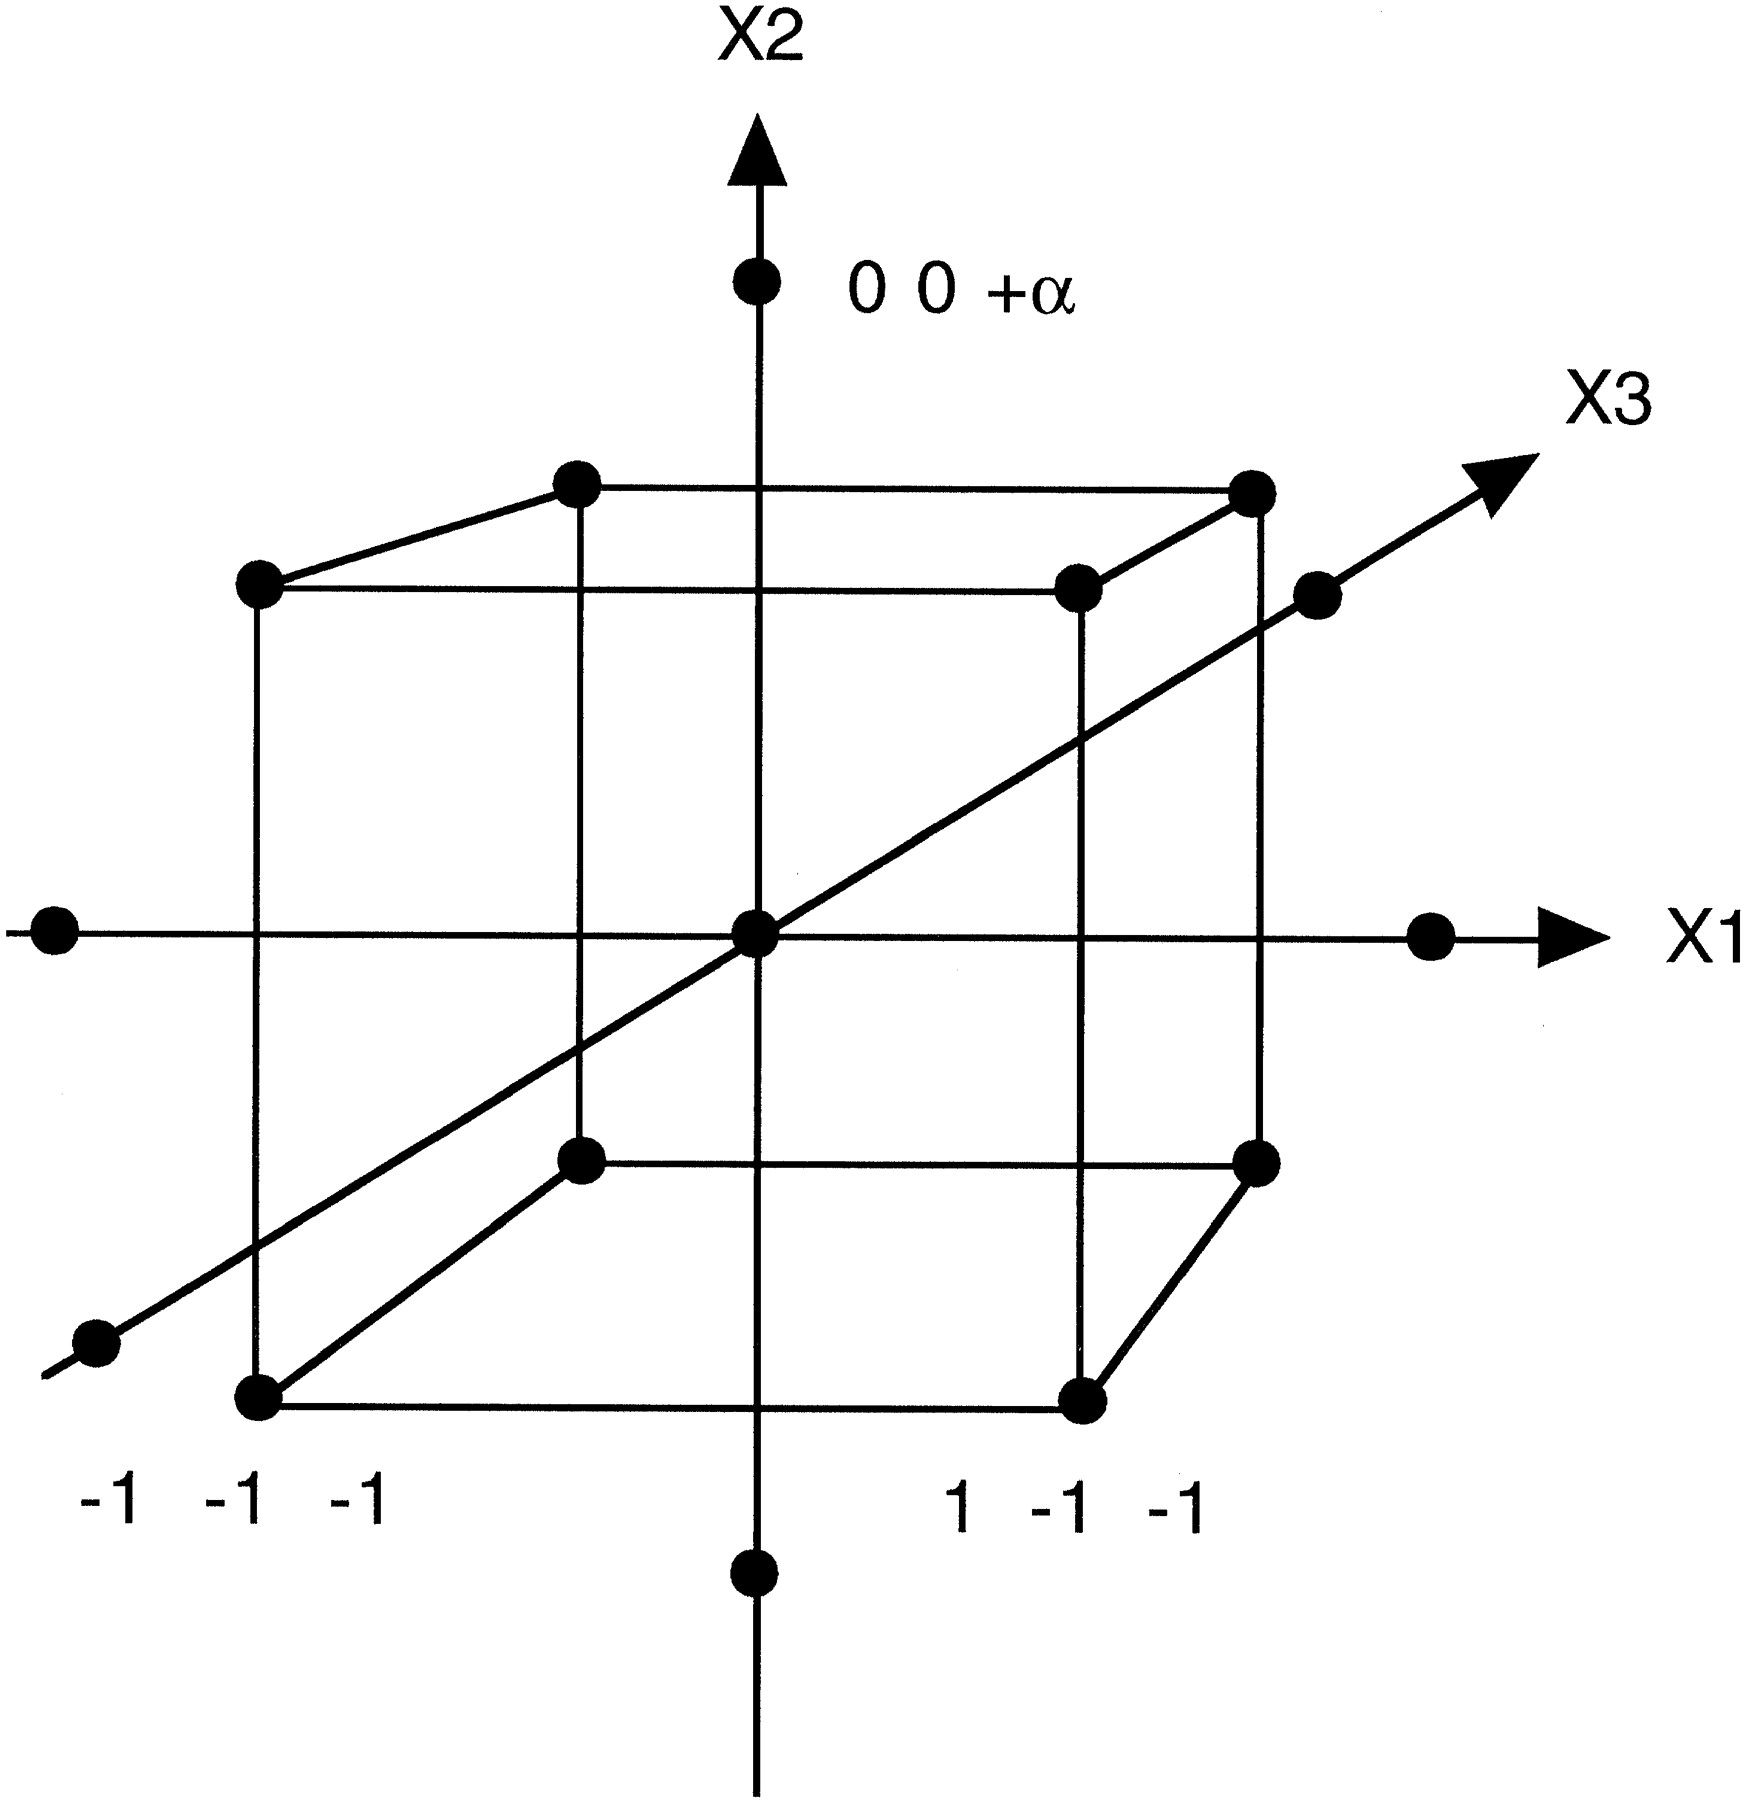
Multivariate Analysis of Factors Influencing Repeat Expansion Detection

(Downloading may take up to 30 seconds. If the slide opens in your browser, select File -> Save As to save it.)

Click on image to view larger version.

Figure 2.
Figure 2.

Distribution of the experimental points in a factorial design. The corners in the cube represent the +/− levels in the design, the central point is in the middle of the cube, and the −α/+α levels should be at the same distance from the central point.

This Article

  1. Genome Res. 8: 1085-1094

Preprint Server