
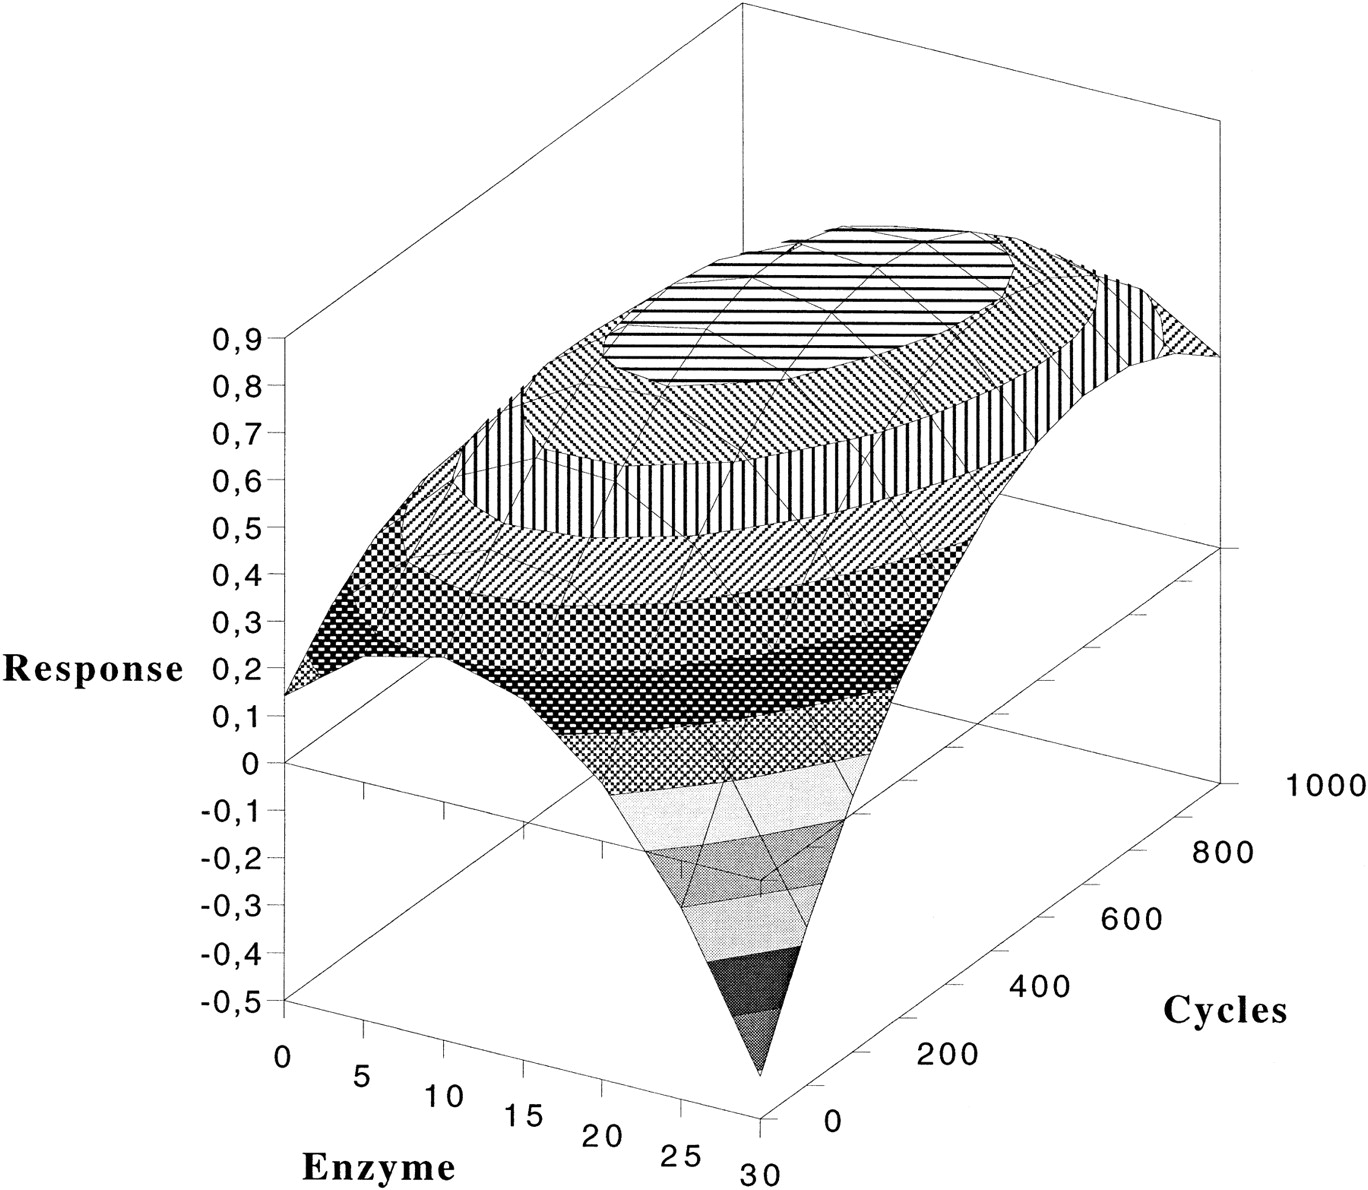
Figure 1.
An example of a response surface plot illustrating the effects of variations in enzyme concentration and cycle number.
(Downloading may take up to 30 seconds. If the slide opens in your browser, select File -> Save As to save it.)
Click on image to view larger version.
An example of a response surface plot illustrating the effects of variations in enzyme concentration and cycle number.
 CiteULike
 Delicious
 Digg
Digg Facebook
 Google+
 Reddit
 Twitter
