
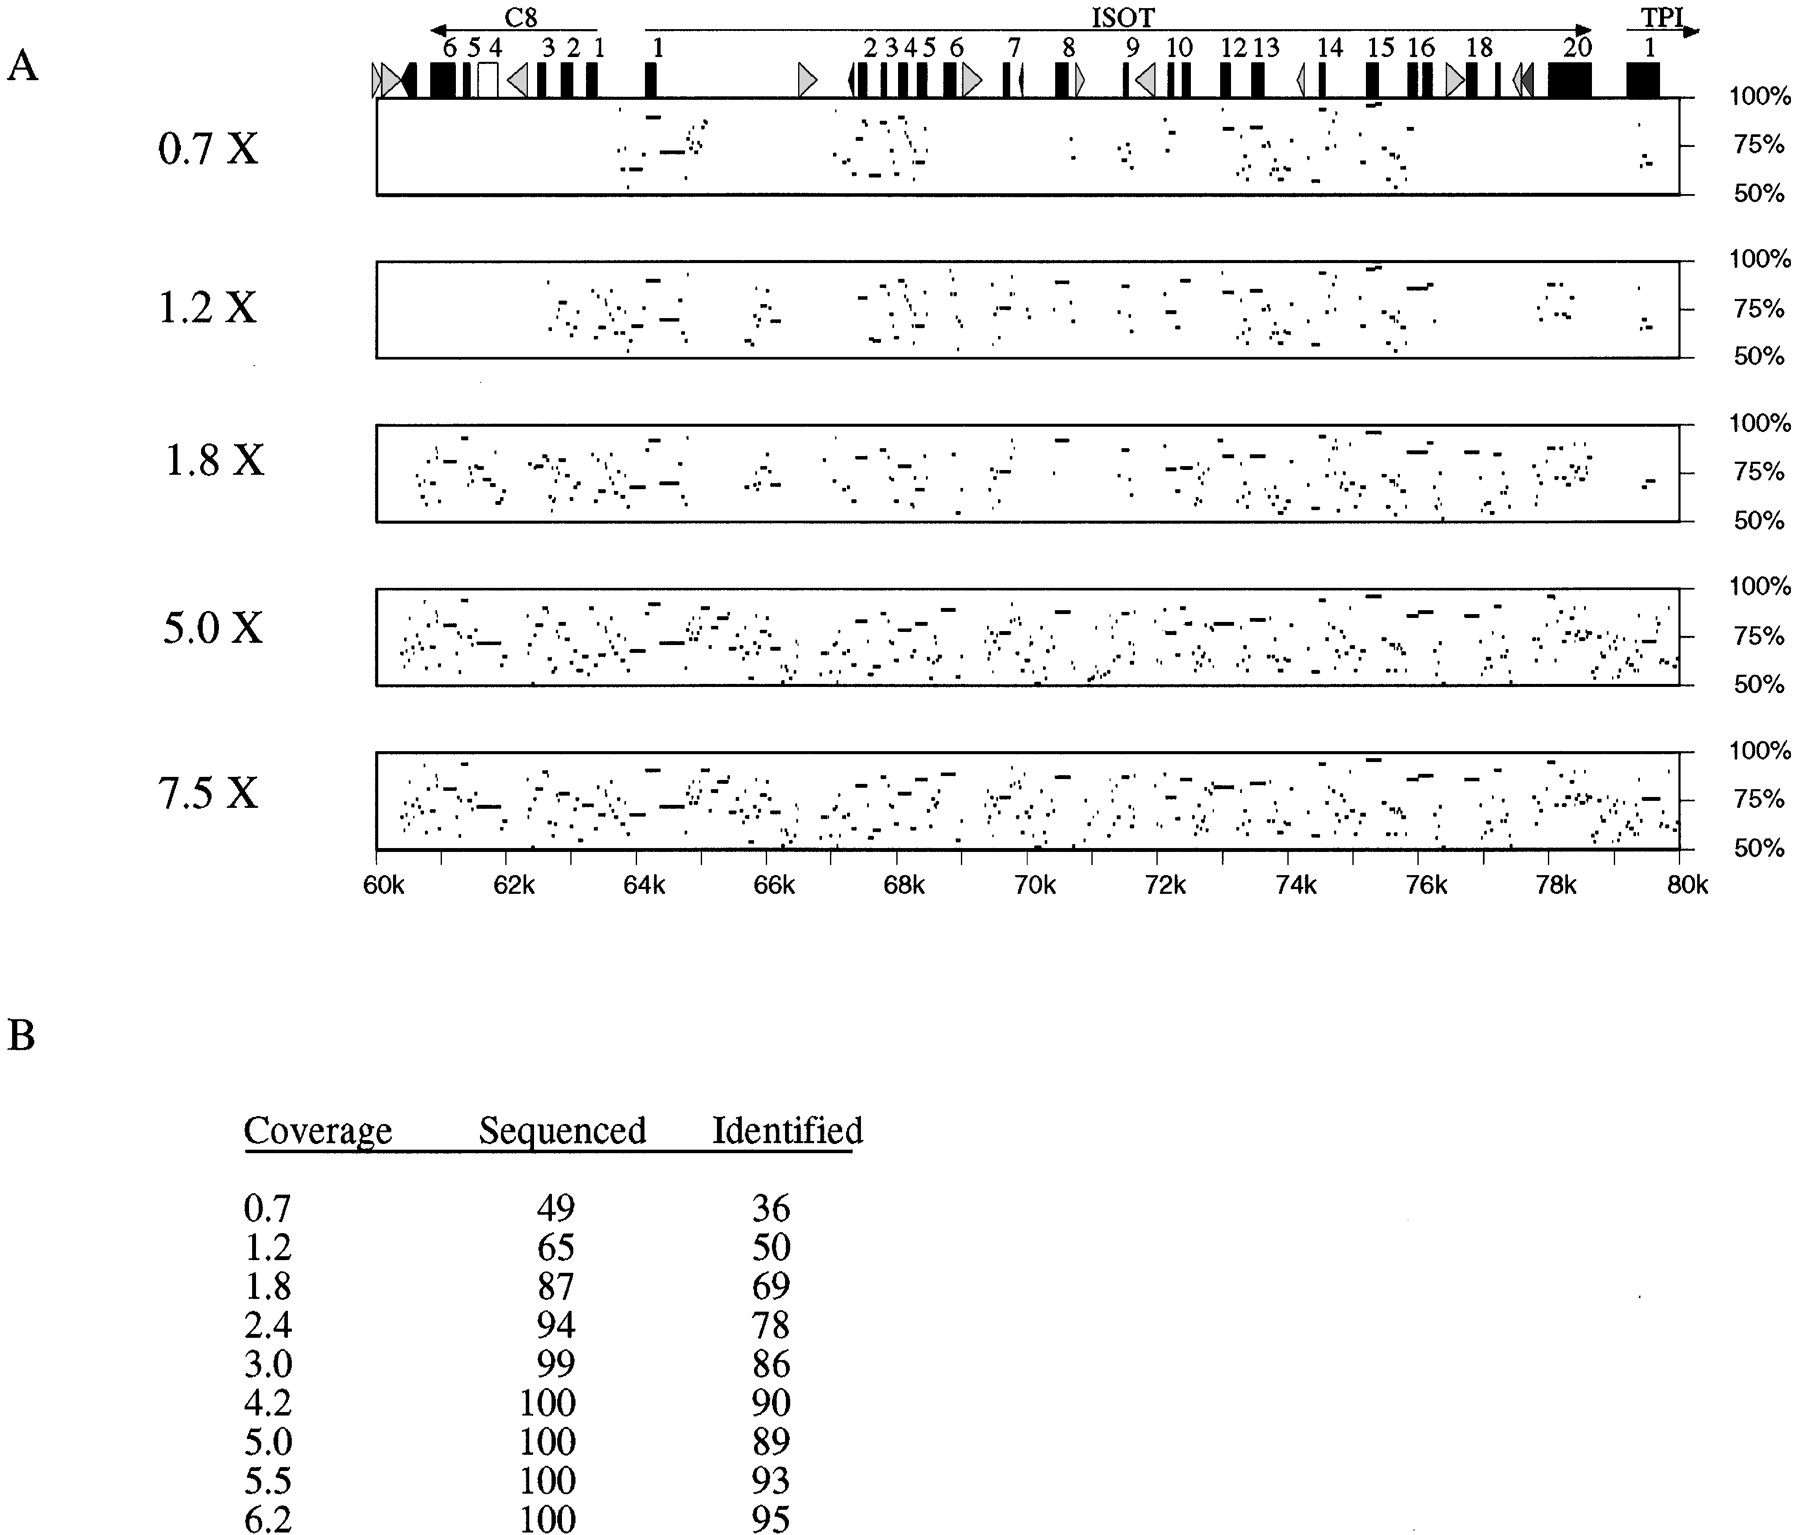
Interspecies comparisons at different levels of redundancy. The consensus sequences generated from low-redundancy sequencing simulations were aligned to the completed sequence. (A) Percent identity between the simulated consensus and the finished sequence is shown for a series of coverages. The fold redundancy is indicated at left, the percent identity is indicated atright, and the distance from the beginning of the project is indicated on the bottom. (Top) The exons and repeats are indicated (see legend to Fig. 4 for description). (B) The number of highly homologous regions that exists between the human and mouse projects was counted. The percent of these regions that were sequenced is indicated (Sequenced), as is the percent of these regions that were identified by a homology search (Identified).


