
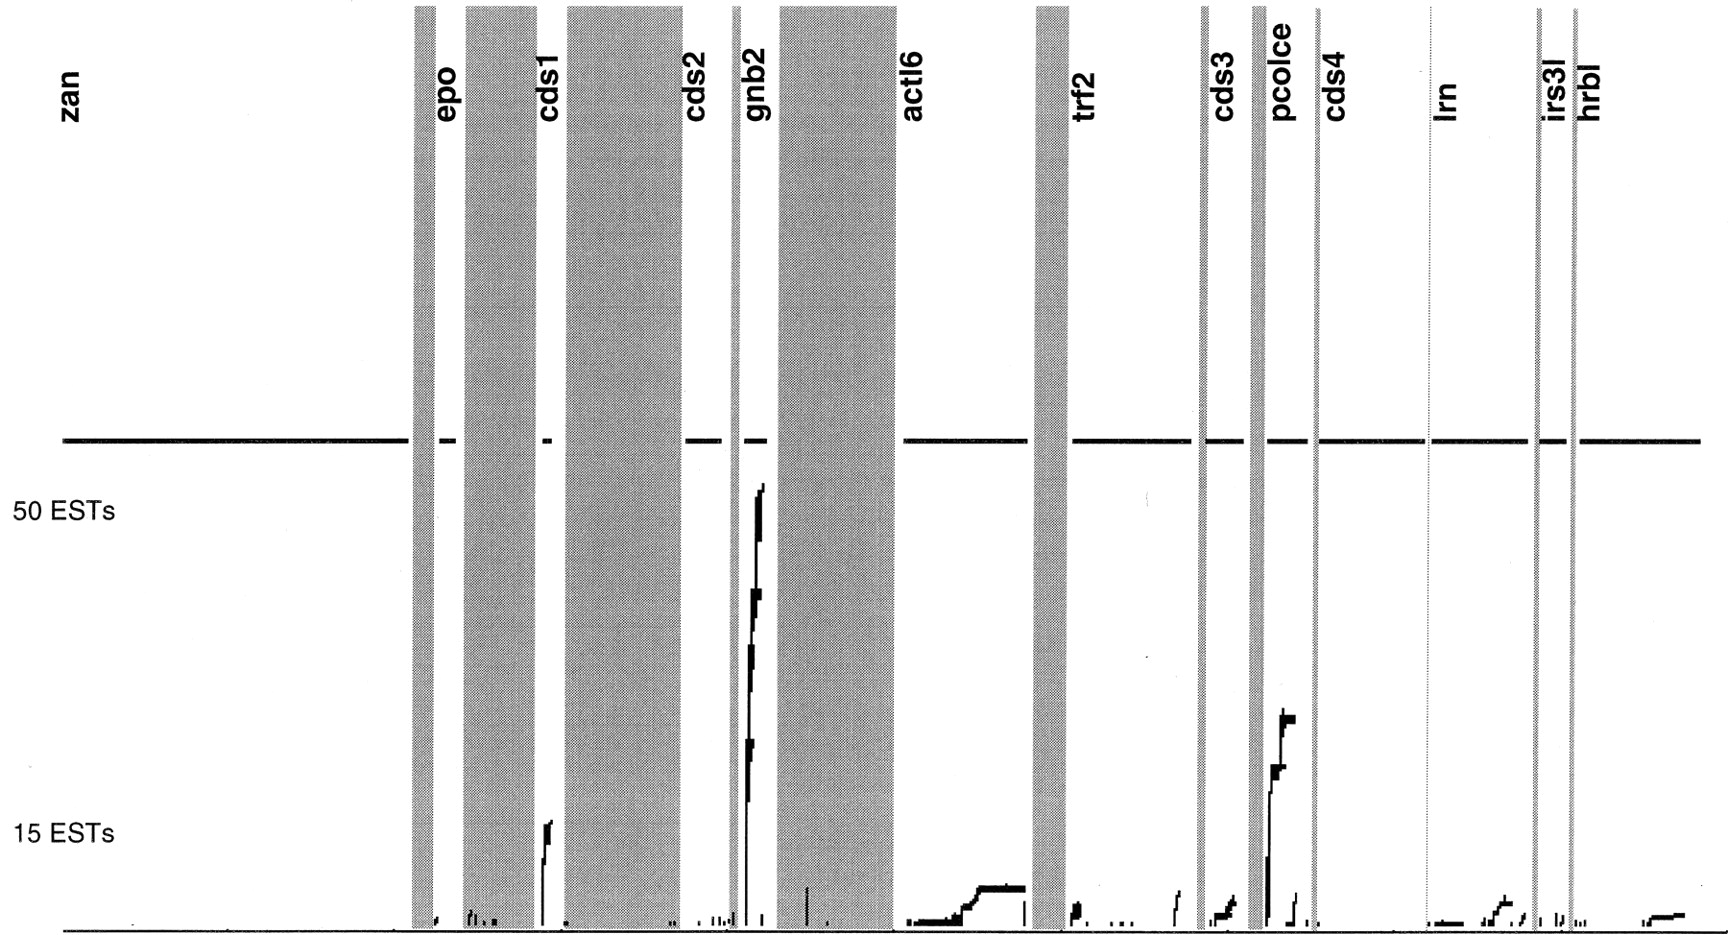
Figure 6.
EST coverage of the total EPO contig. All matches of ESTs to the EPO contig in either strand are shown as lines. Matches of the same EST are represented by lines covering the whole region within the matches. Regions of the genes found are drawn above the EST matches.


