
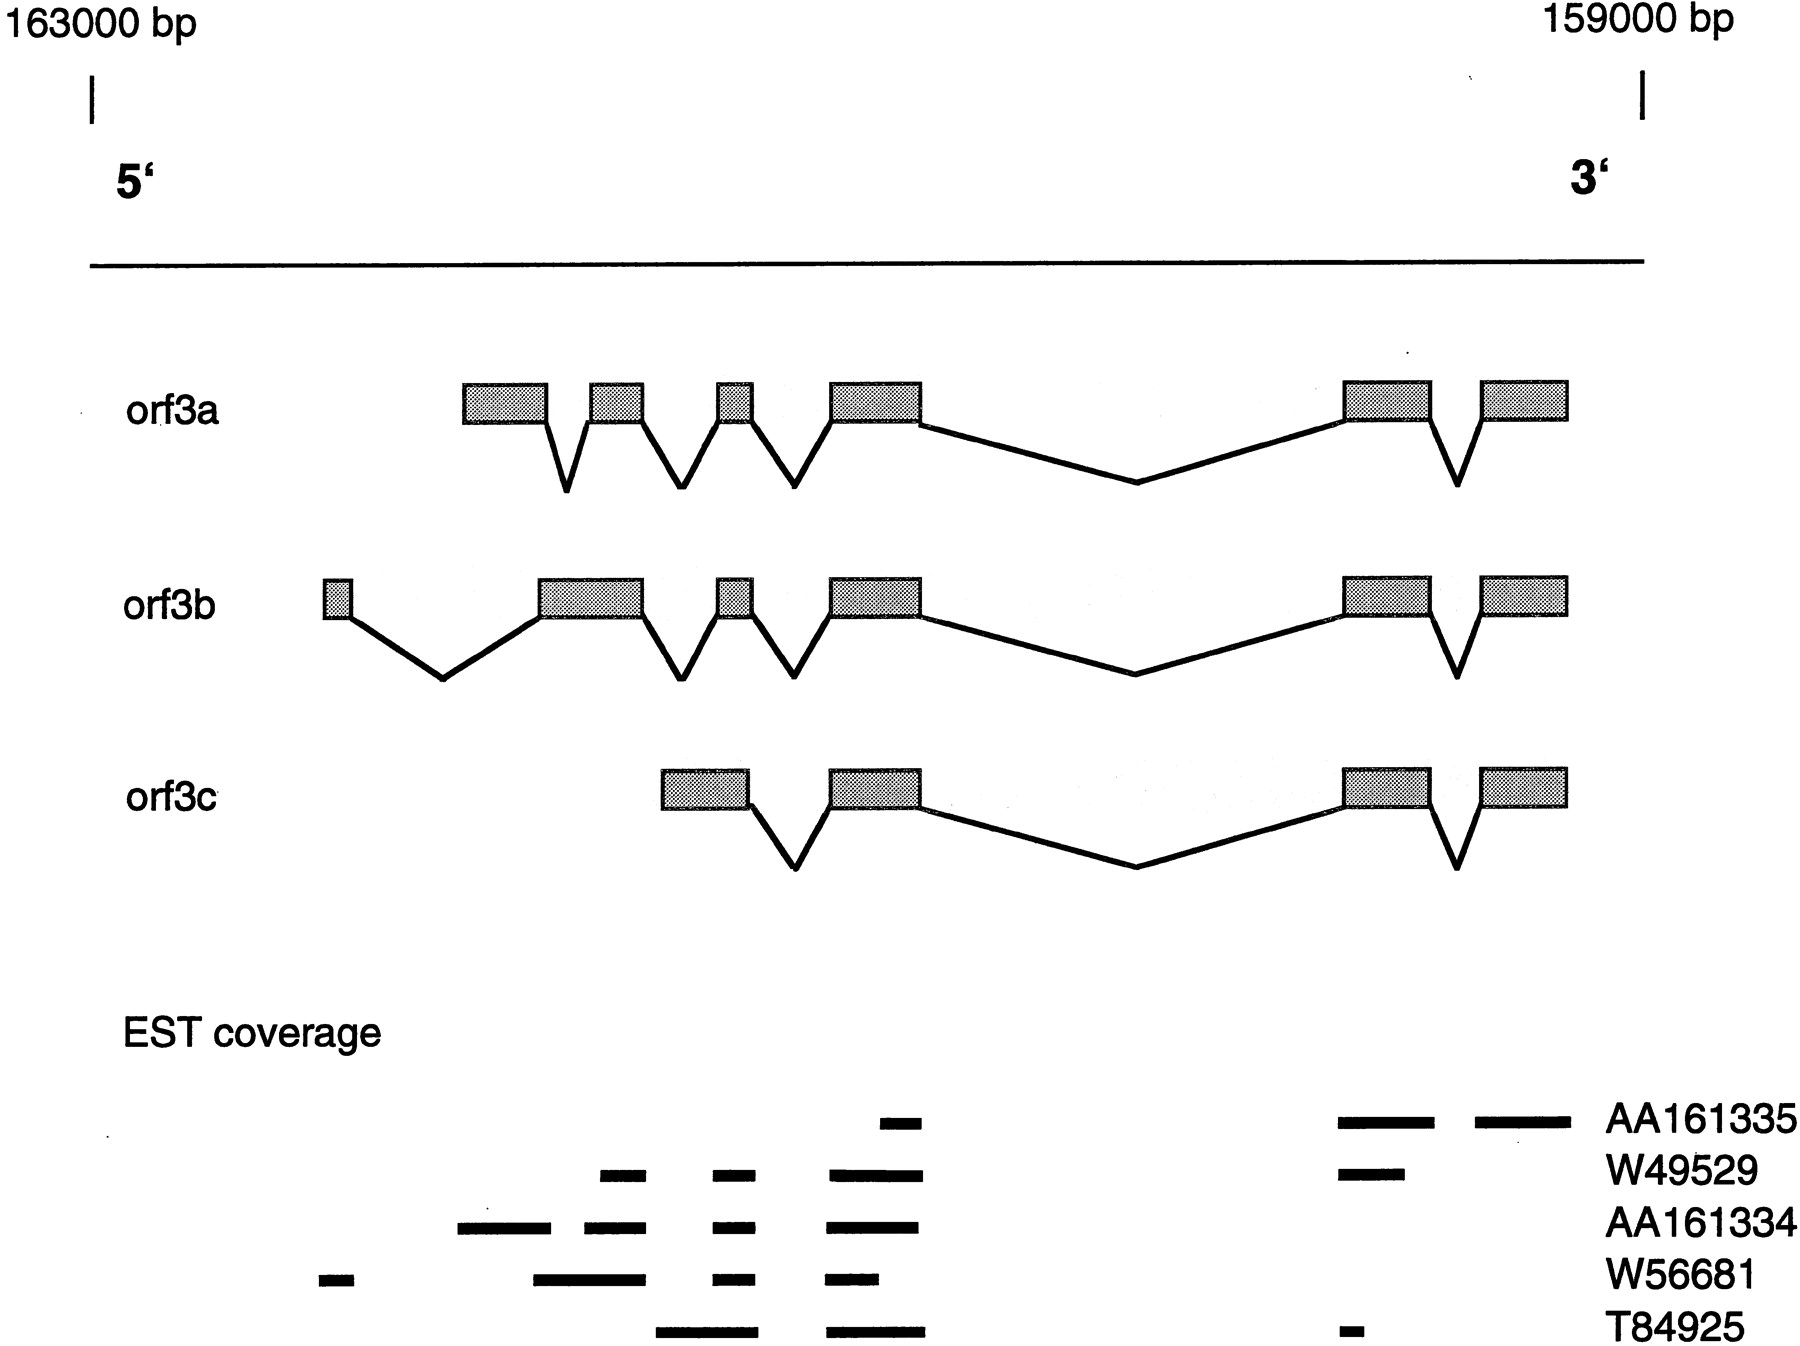
Figure 5.
The splice variants of CDS3. Rectangles connected by lines indicate the different gene structures of the splice variants. The minimal EST coverage of the splice variants is drawn below the gene structures. The gene location on the EPO contig, together with the transcription direction, is given above the line representing the sequence.


