
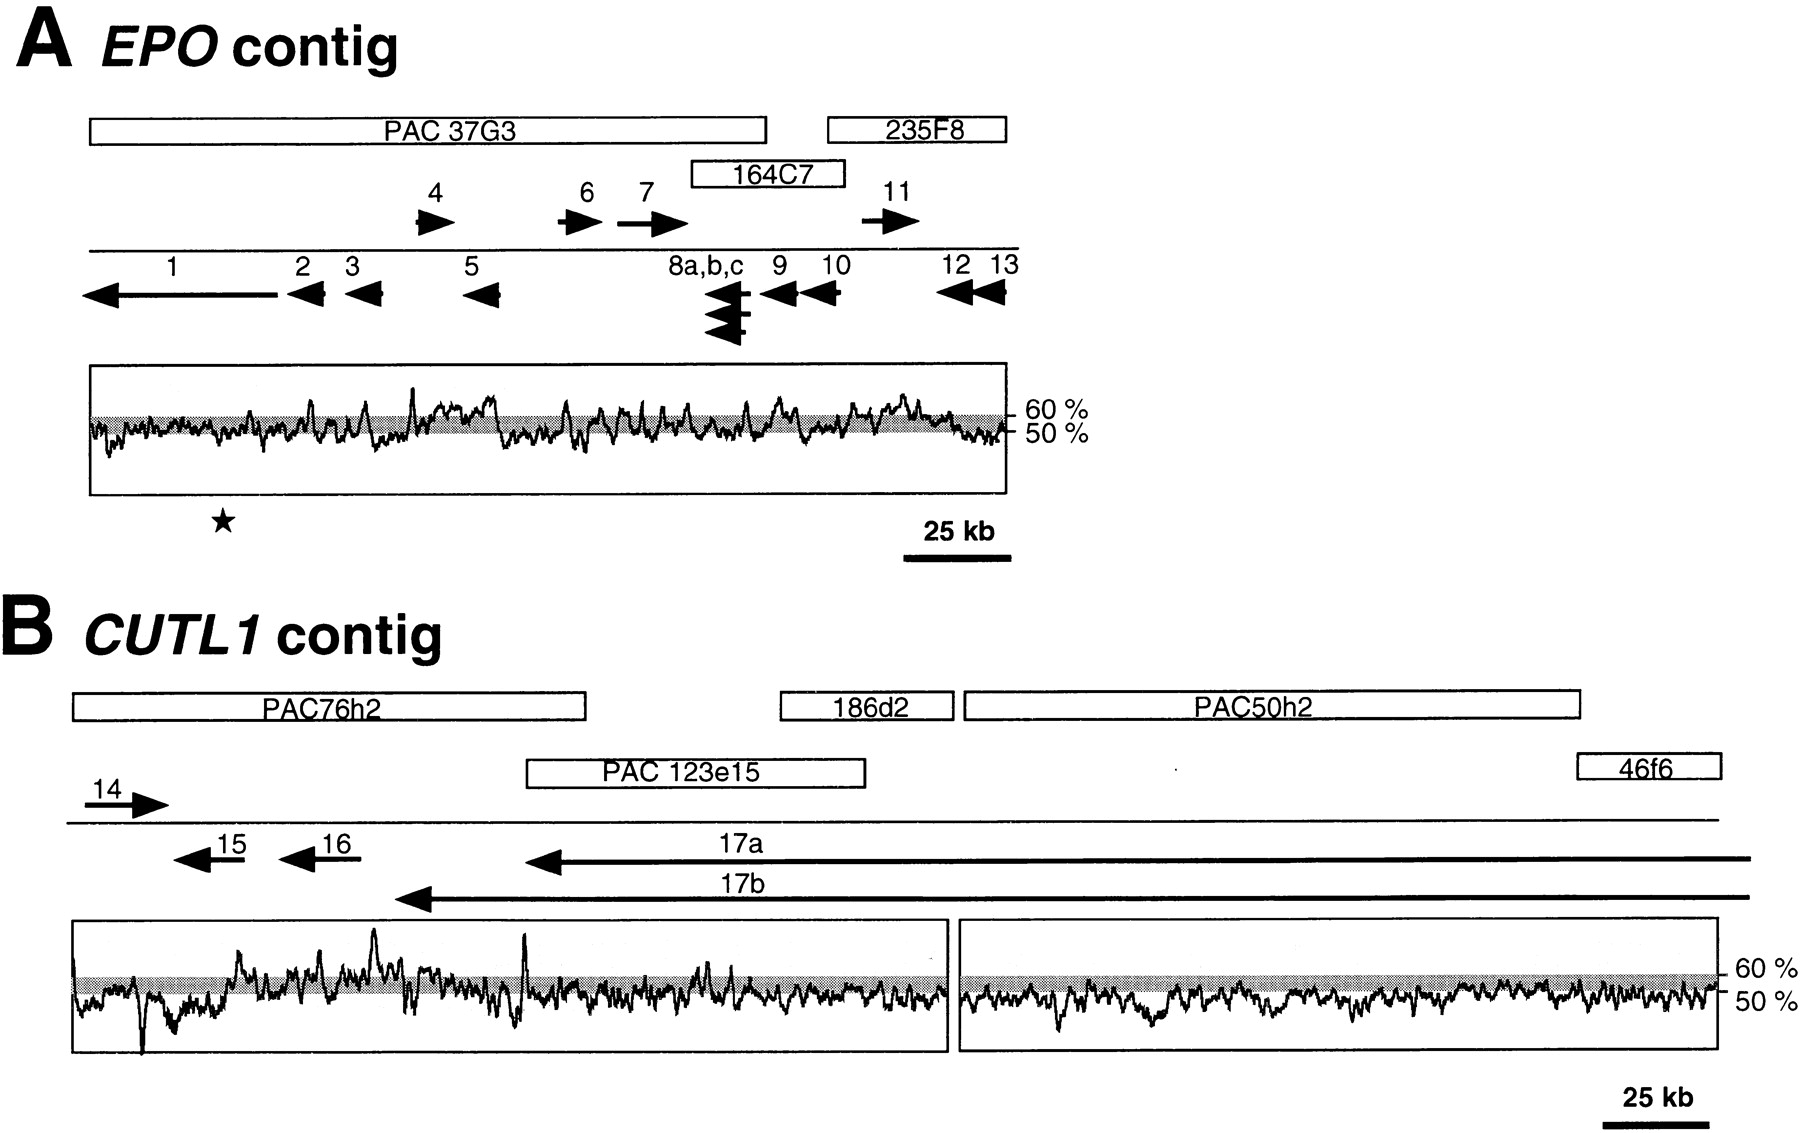
Figure 2.
Map of the sequenced contigs. Sequenced clones are drawn as open rectangles containing the clone names. Arrows indicate the genes and their transcriptional directions. The genes are (1) ZAN, (2)EPO, (3) CDS1, (4) CDS2, (5) GNB2, (6) ACTL6, (7) TFR2, (8) CDS3, (9)PCOLCE, (10) CDS4, (11) LRN, (12)IRS3L, (13) HRBL, (14) CDS5, (15)PMSL12, (16) APS, and (17) CUTL1. The GC content is drawn below the gene arrows with a step of 1000 and a sliding window of 100. (A) EPO contig. The single sequencing gap is indicated by a star. (B) CUTL1contig. The cloning gap is not drawn to scale.


