
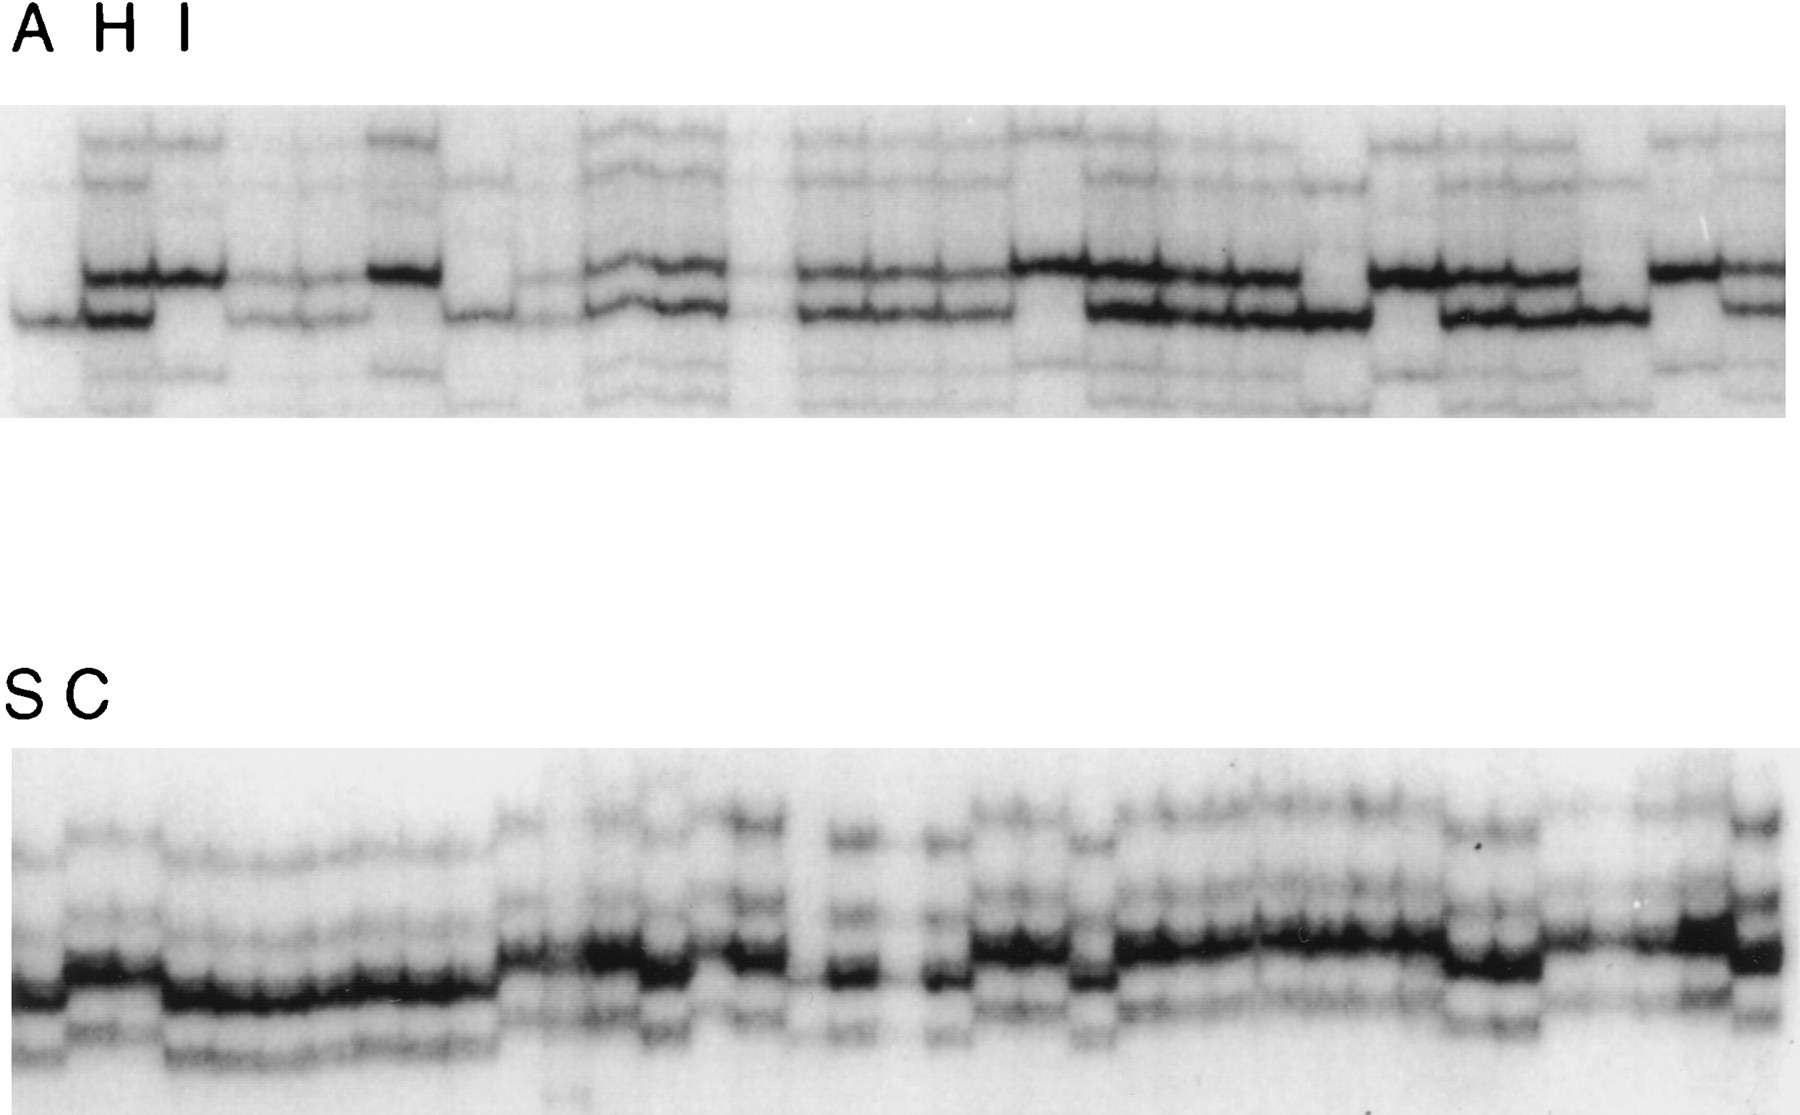
Figure 3.
SSCP analysis of expressed sequences. Genotype distributions of two different primer pairs corresponding to 3′ UTR of expressed sequences are shown in progeny of two reference crosses. (Top): Reference cross described by Knapik et al. (1996). Lanes correspond to diploid progeny of AB × India intercross. (A): AB homozygote; (H): heterozygote; (I): India homozygote. (Bottom): Reference cross described by Postlethwait et al. (1994). Lanes correspond to haploid progeny of SJD × C32 intercross. (S): SJD; (C): C32.


