
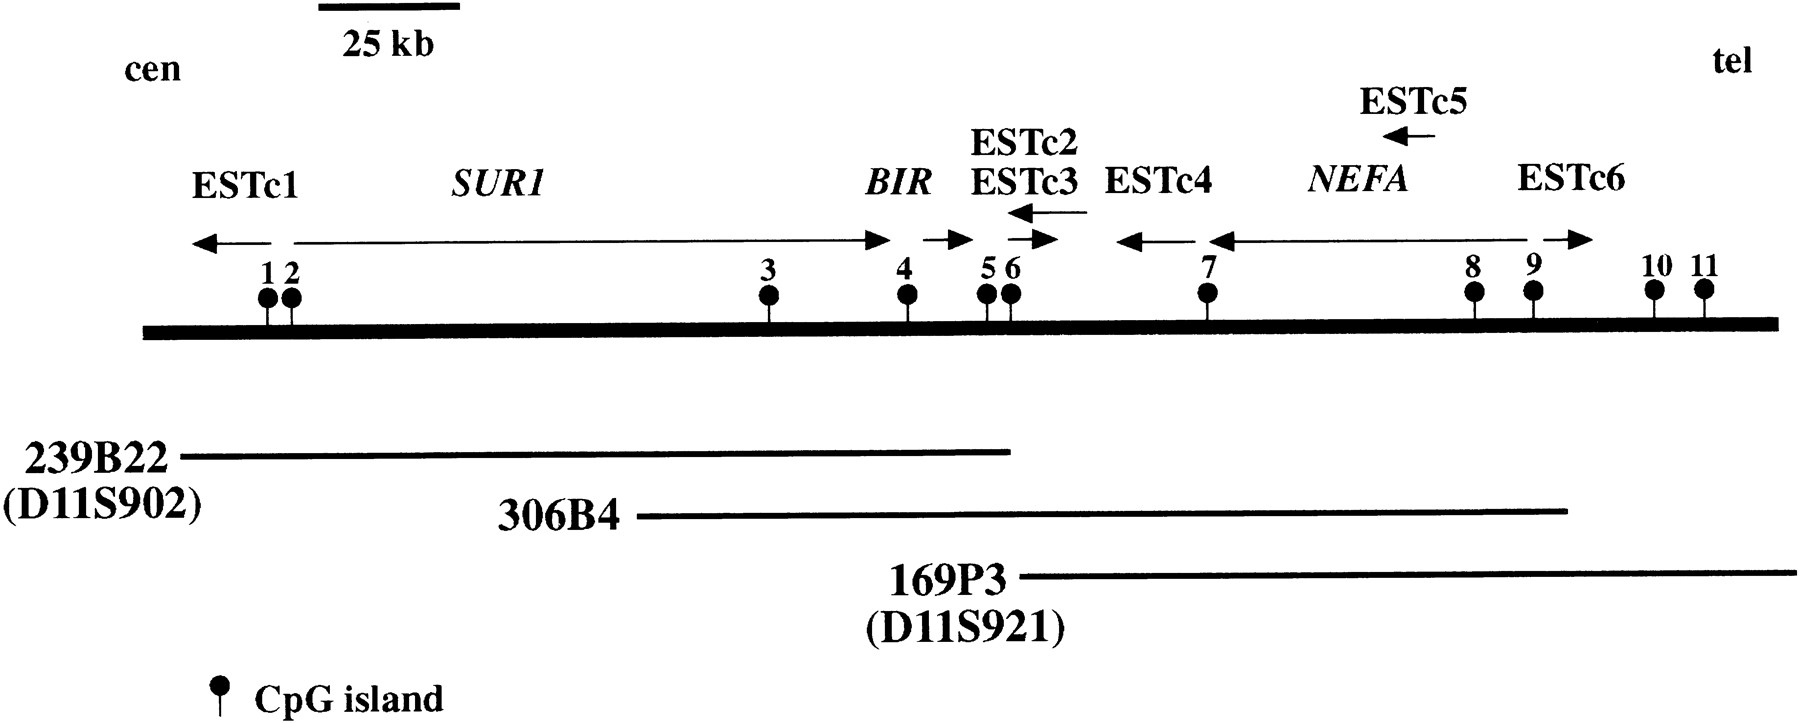
Figure 3.
Transcript map of a portion of the USH1C critical region. Known genes and ESTs are shown relative to the sequenced PAC clones. Arrows indicate the direction of transcription; CpG islands are indicated as lollipops.


