
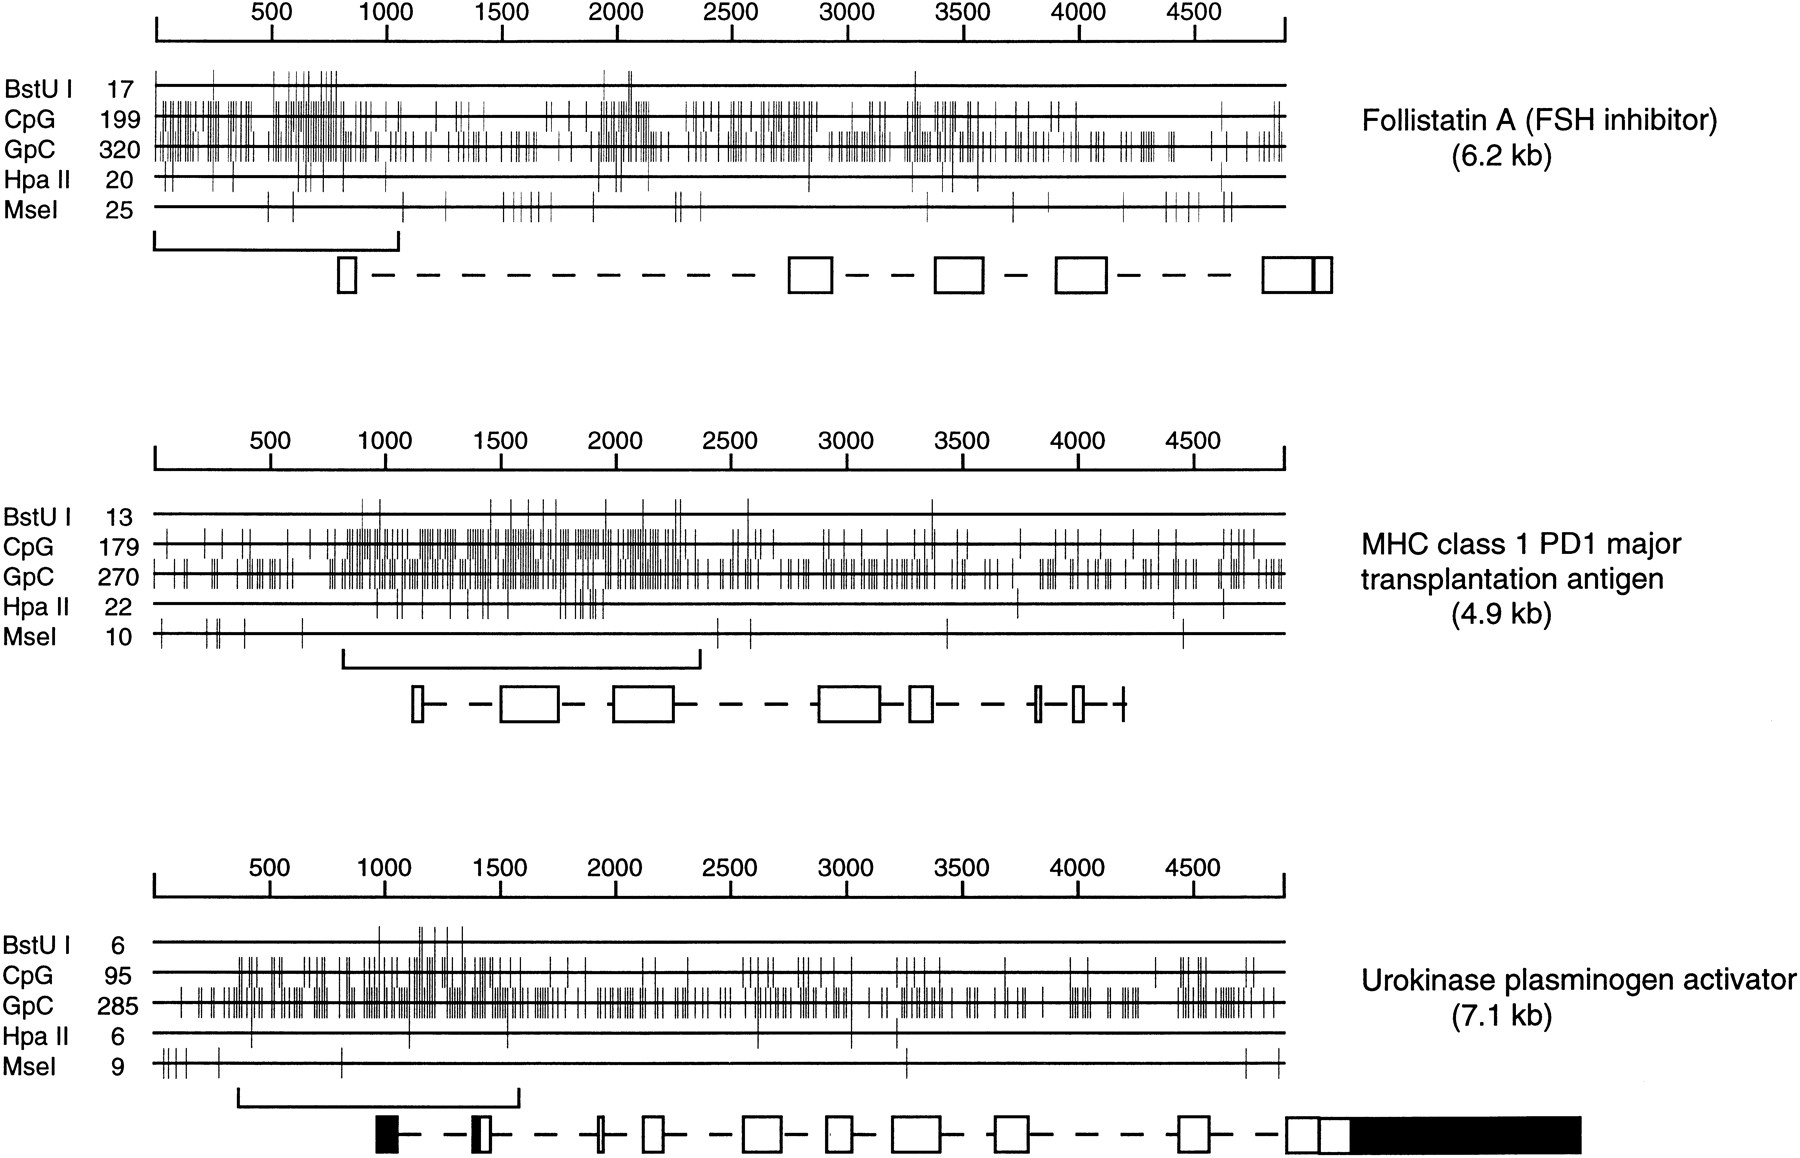
Figure 1.
Three pig CpG island genes. The size (in bp) is shown above each genomic sequence, and the CGI is bracketed below. Exons are shown as solid boxes when untranslated. The positions of target sites are shown for two GC-rich cutters (BstUI and HpaII) and forMseI, whose target site is TTAA. The frequencies of CpG and GpC dinucleotides within the sequence are also shown.


