
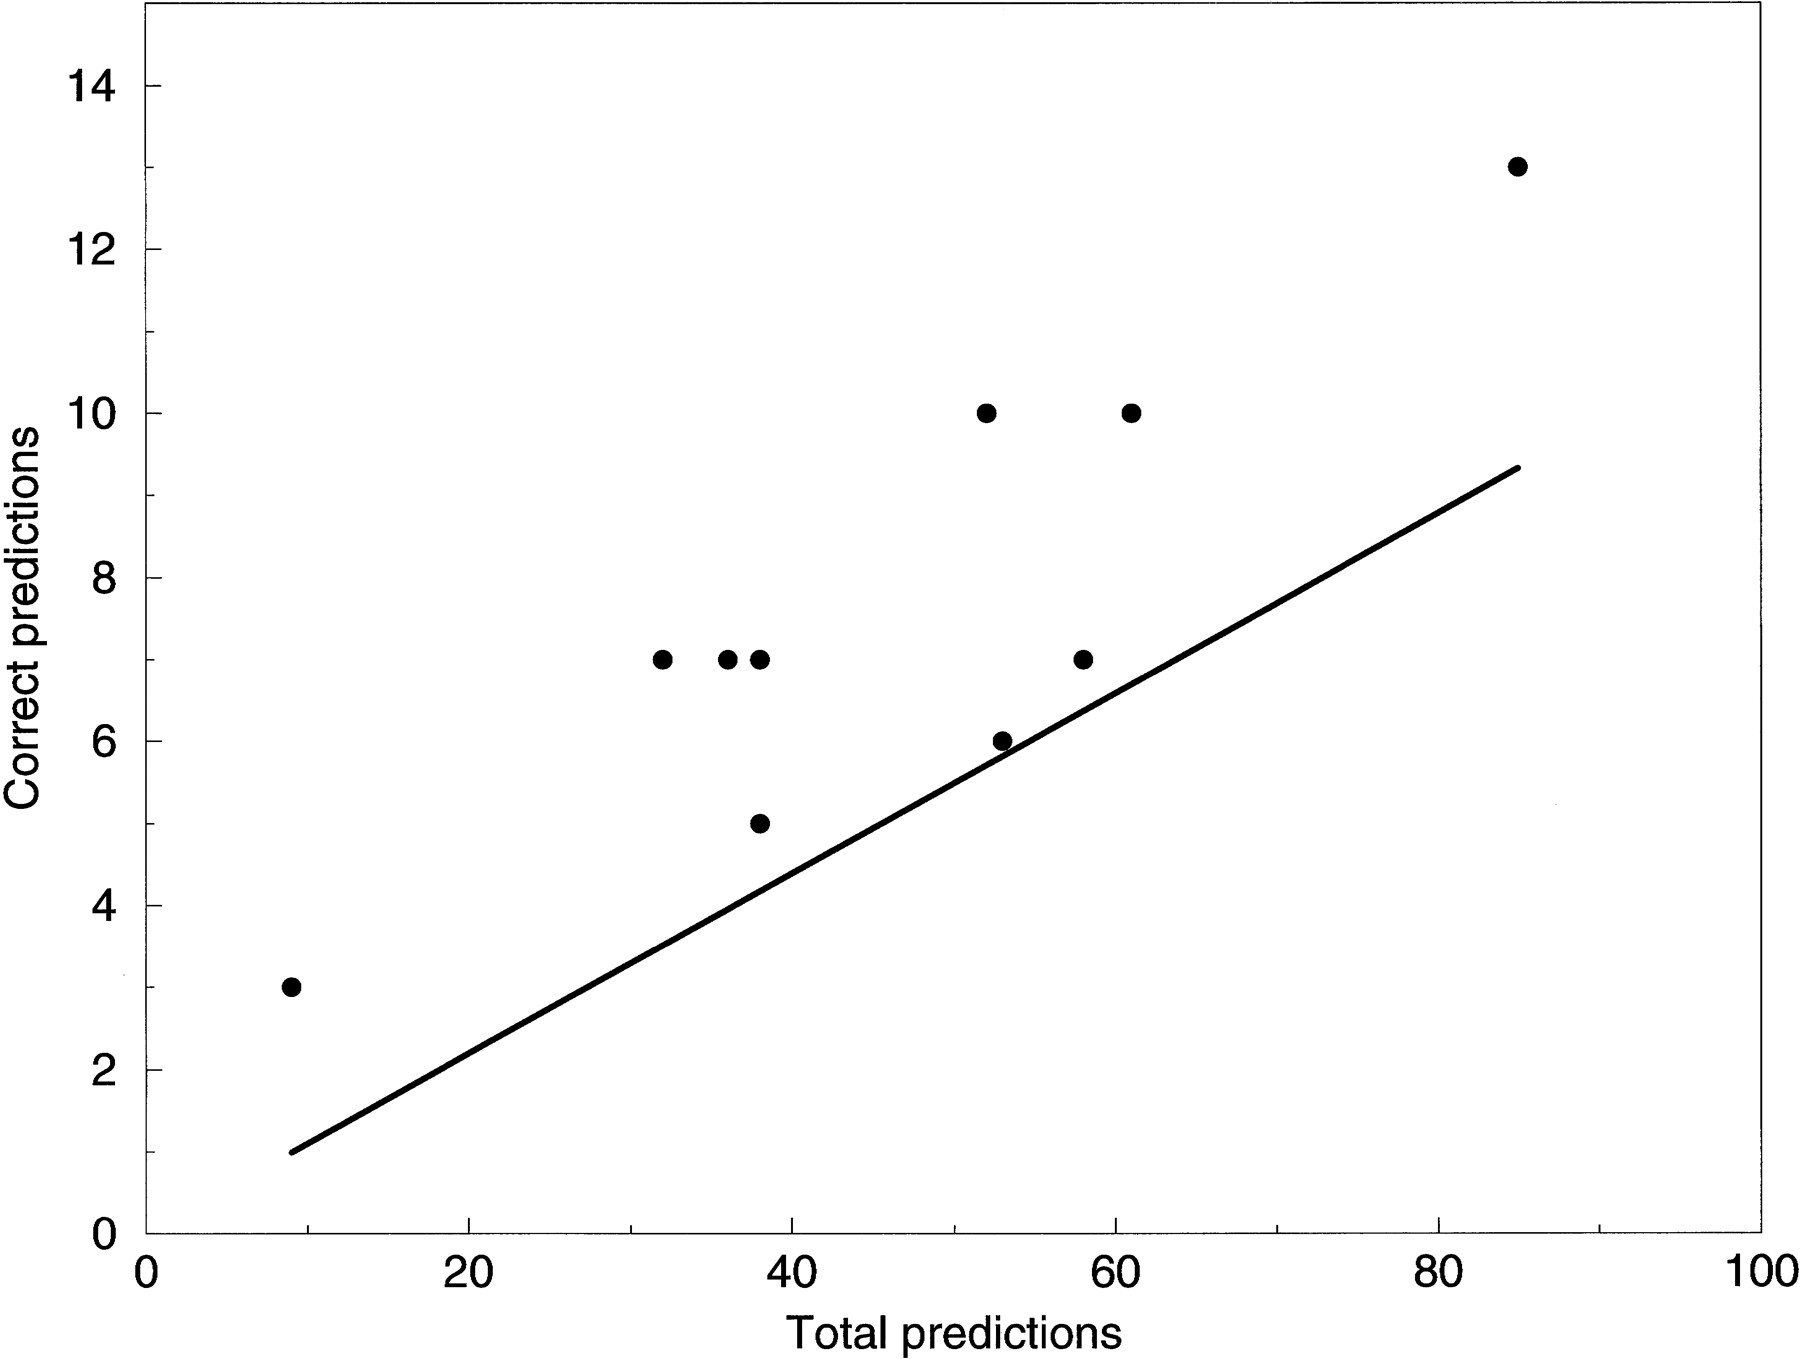
Figure 1.
Each point plotted represents the accuracy of one program, with the abscissa being the total number of predictions made by the program, and the ordinate being the number of correct predictions. For comparison the line y = 0.11x is plotted. 0.11 is the fraction of all bases in the test set where a prediction would be counted as correct, so that points on the line would reflect the accuracy, on average, of random predictions.


