
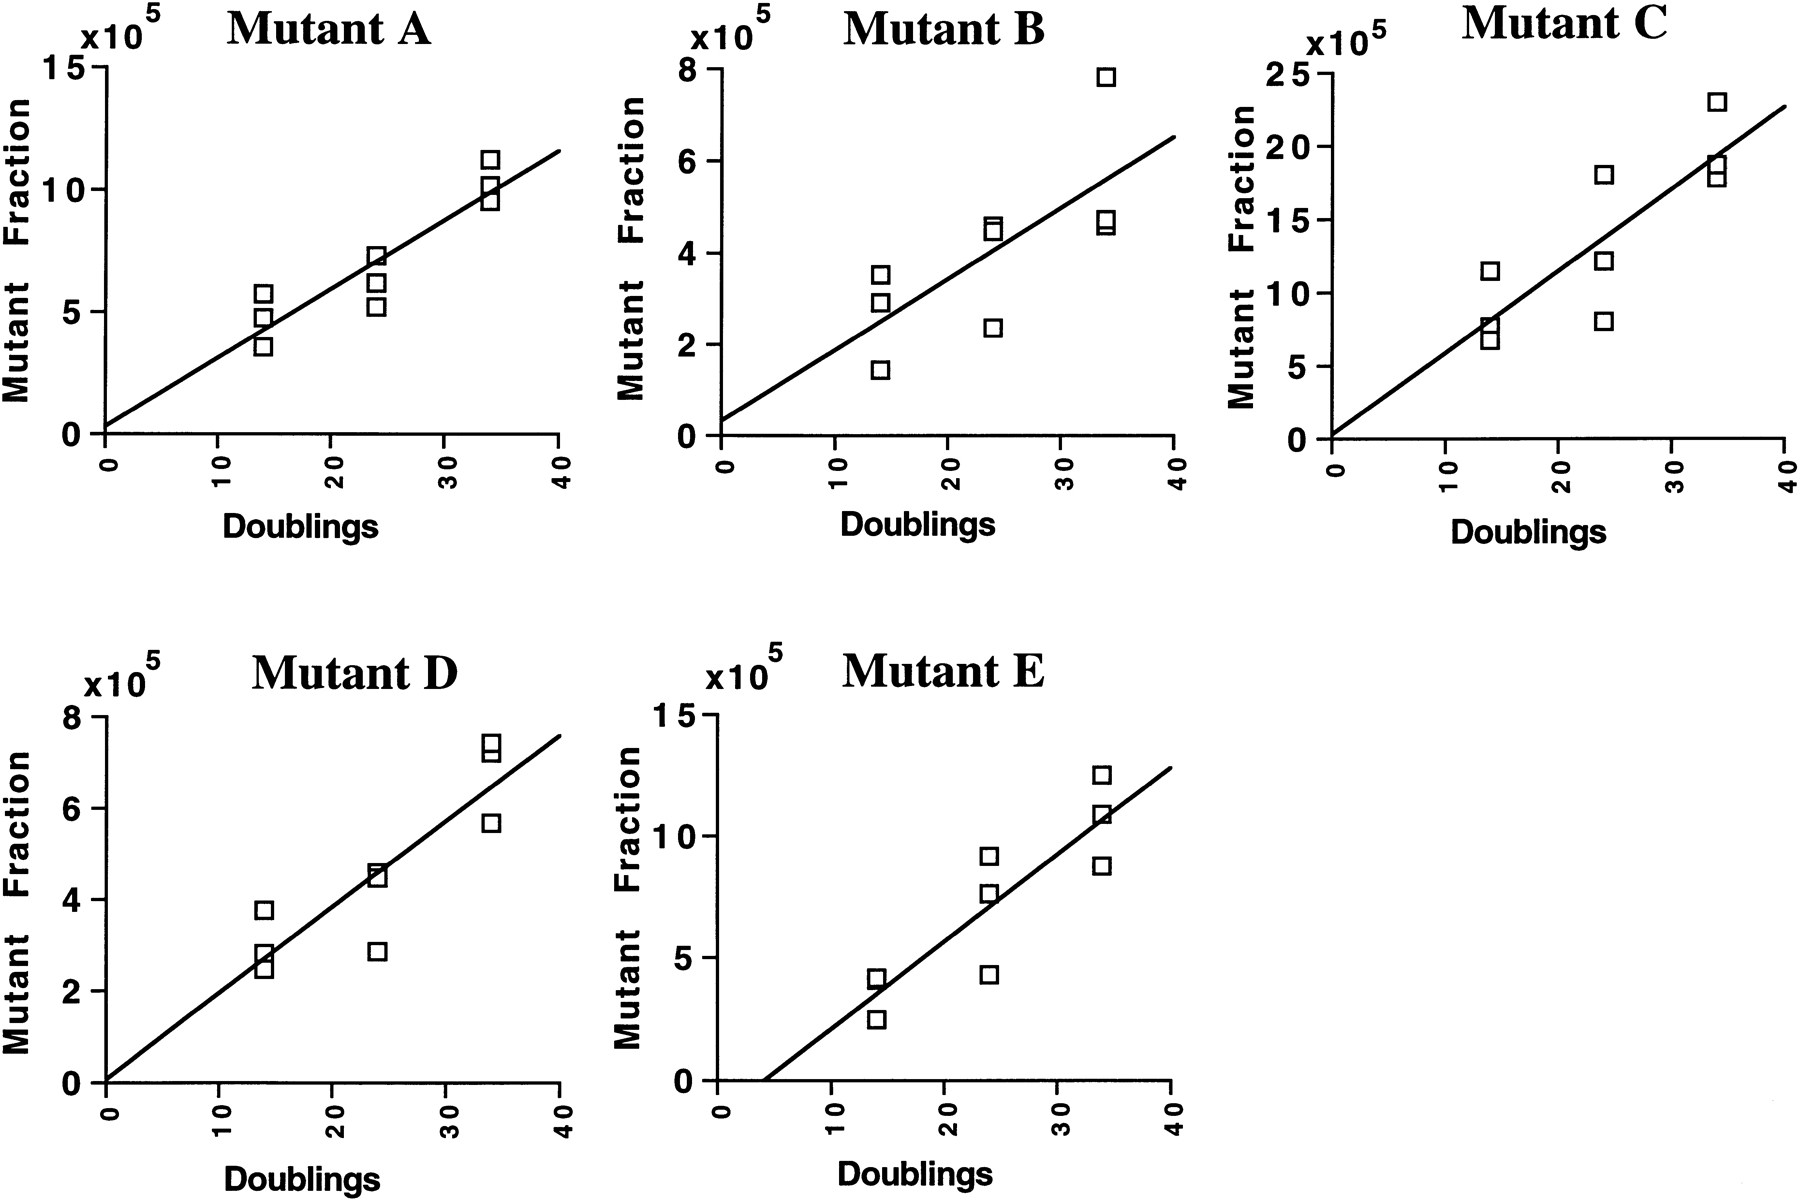
Figure 4.
Plots of the mutant hot spot fractions vs. the amount of DNA doublings using data from three independent experiments. A linear regression analysis was applied to all data points. The mutation rate per doubling for each hot spot was estimated from the slope. The mutation rate for hot spot A was 2.8 ± 1.1 × 10⁻⁶; for hot spot B, 1.6 ± 1.3 × 10⁻⁶; for hot spot C, 5.6 ± 3.3 × 10⁻⁶; for hot spot D, 1.9 ± 0.9 × 10⁻⁶; and for hot spot E, 3.6 ± 1.7 × 10⁻⁶ (95% confidence intervals for the best estimates of the slopes).


