
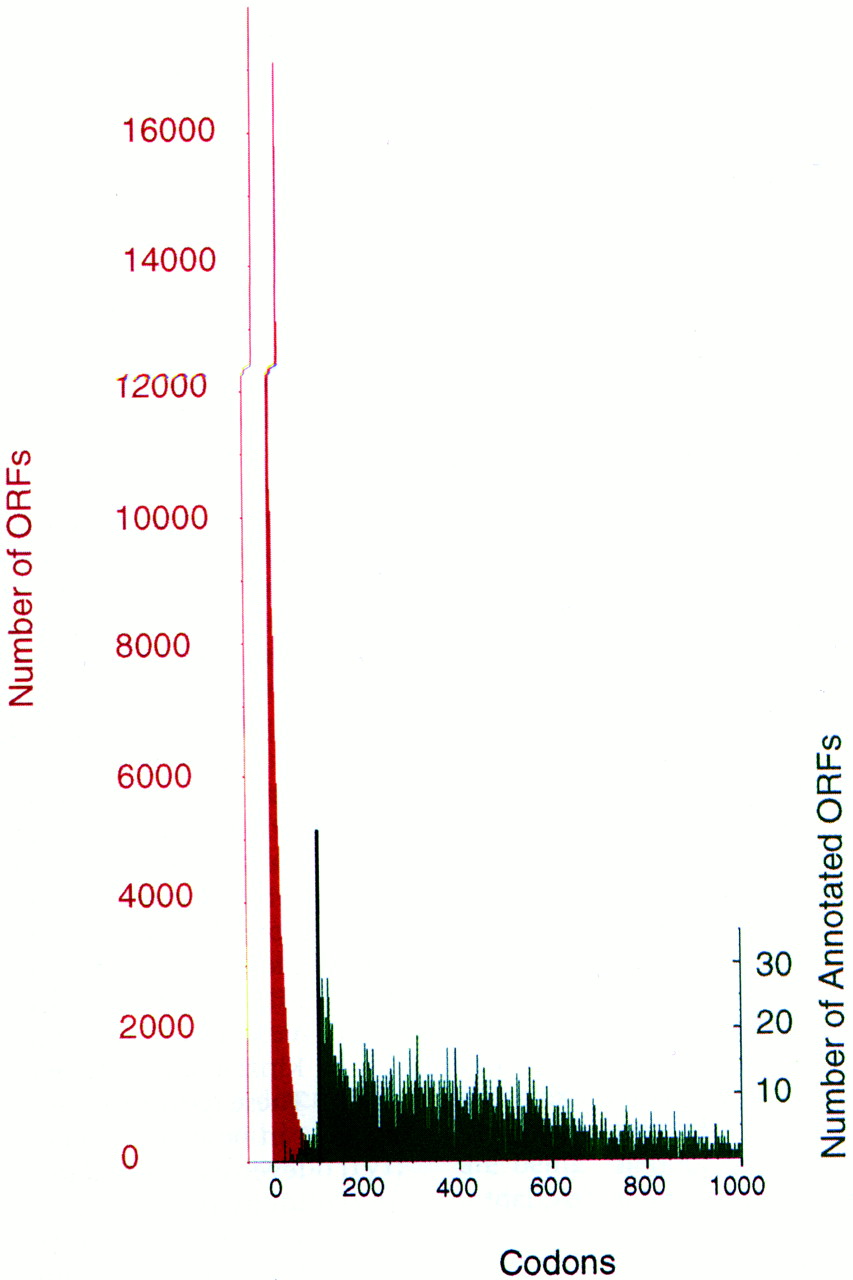
The total number of ORFs of the indicated length encoded in the S. cerevisiae genome are shown in red. The total number of annotated ORFs in SGD are plotted in green. Note that the scale for the total number of ORFs is 100-fold compressed relative to the number of annotated ORFs. Therefore, the difference in magnitude of these curves is actually under-represented by 100-fold. A curve shaped similarly to the red curve but of smaller amplitude is obtained if only the interfeature regions are searched for total ORFs (not shown). The black vertical line at 100 amino acids indicates the cutoff chosen for annotating the genes. (We thank M. Cherry of SGD for kindly providing the data for this graph.)


