
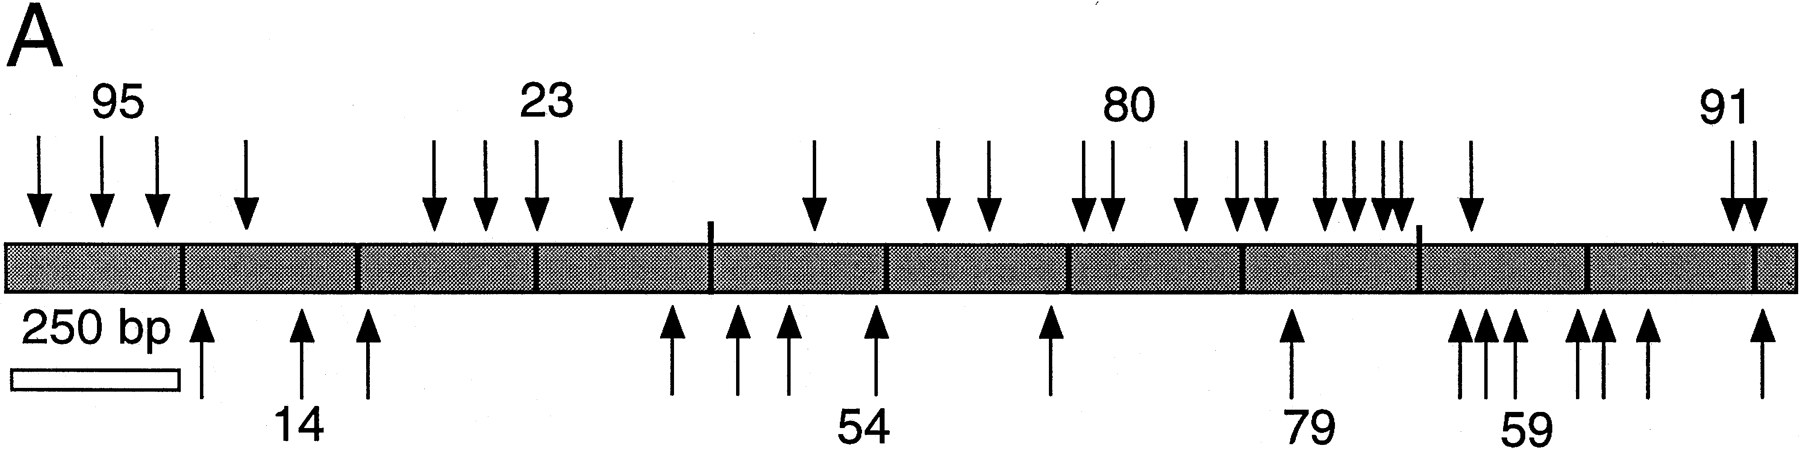
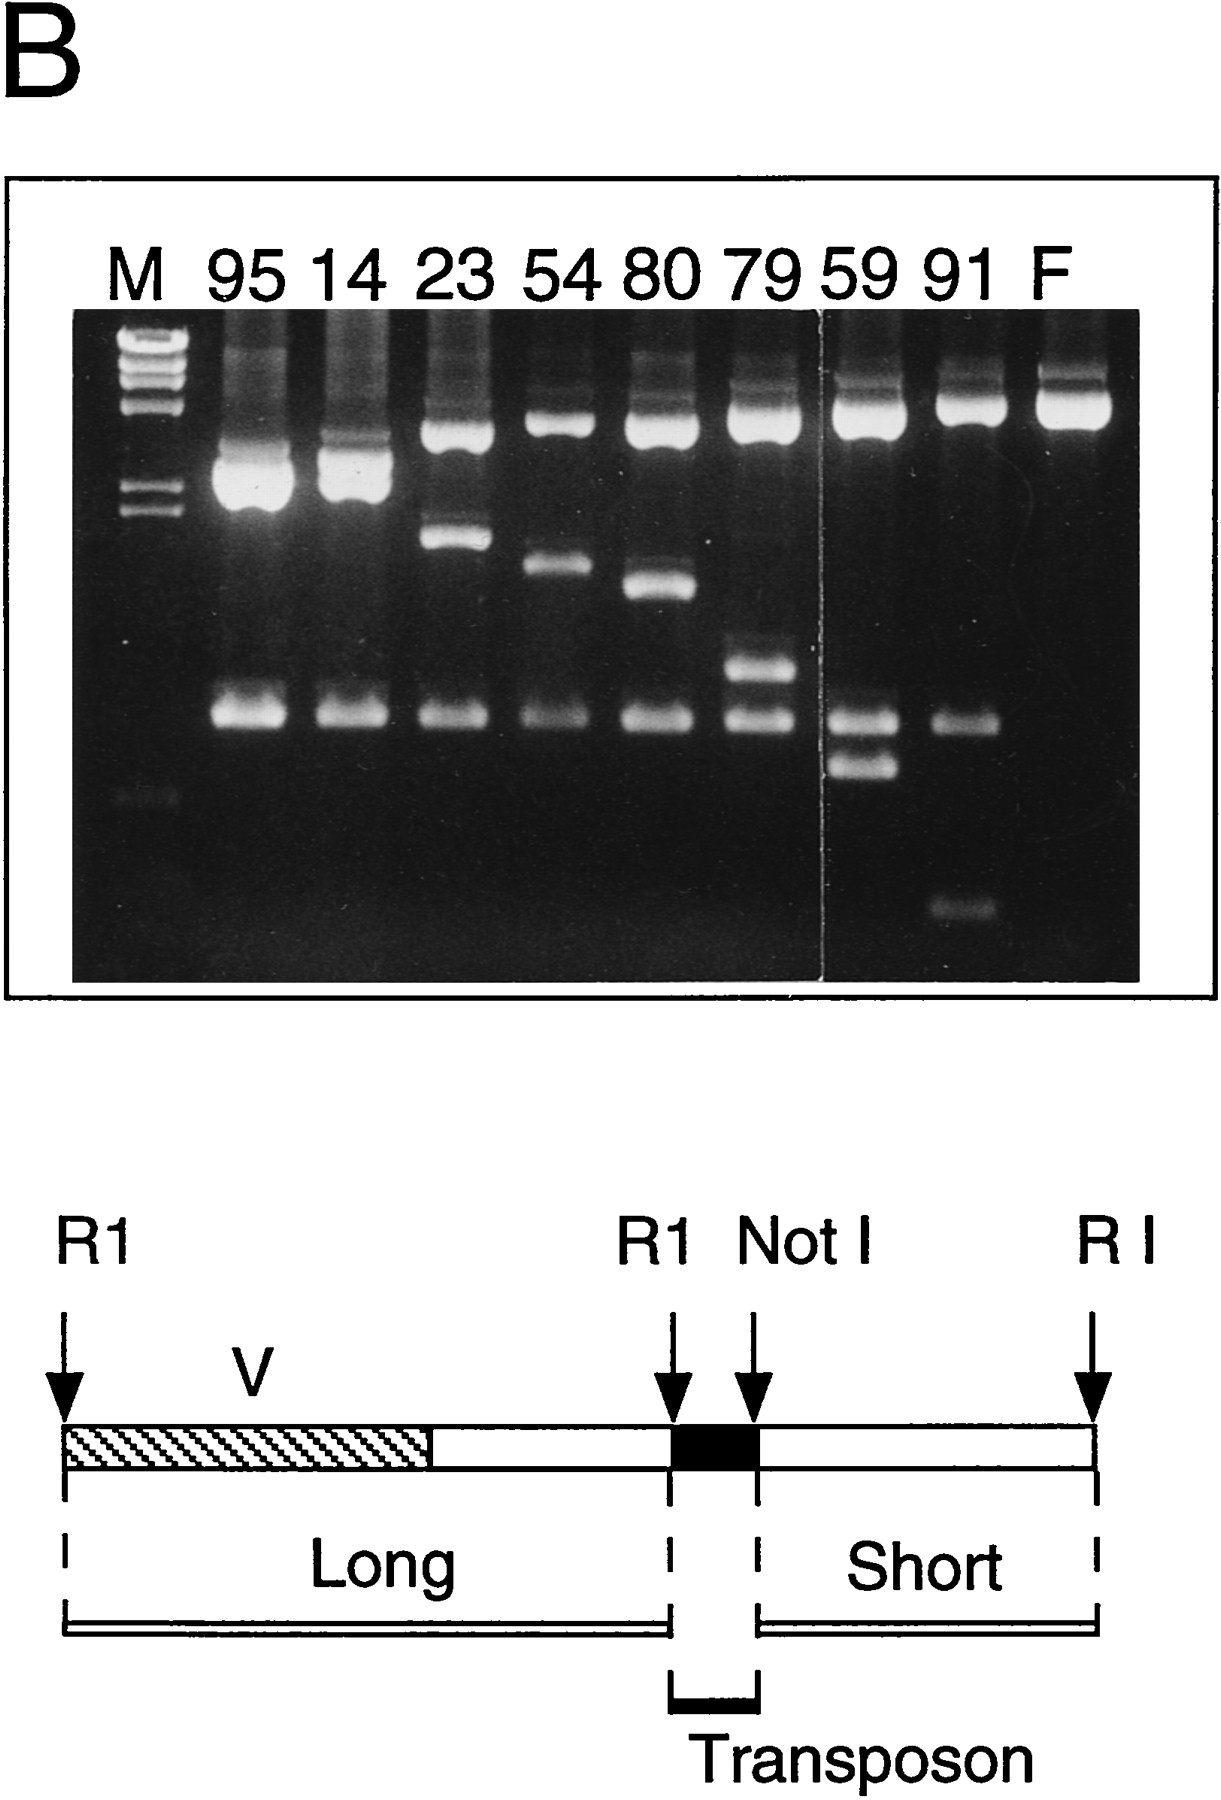
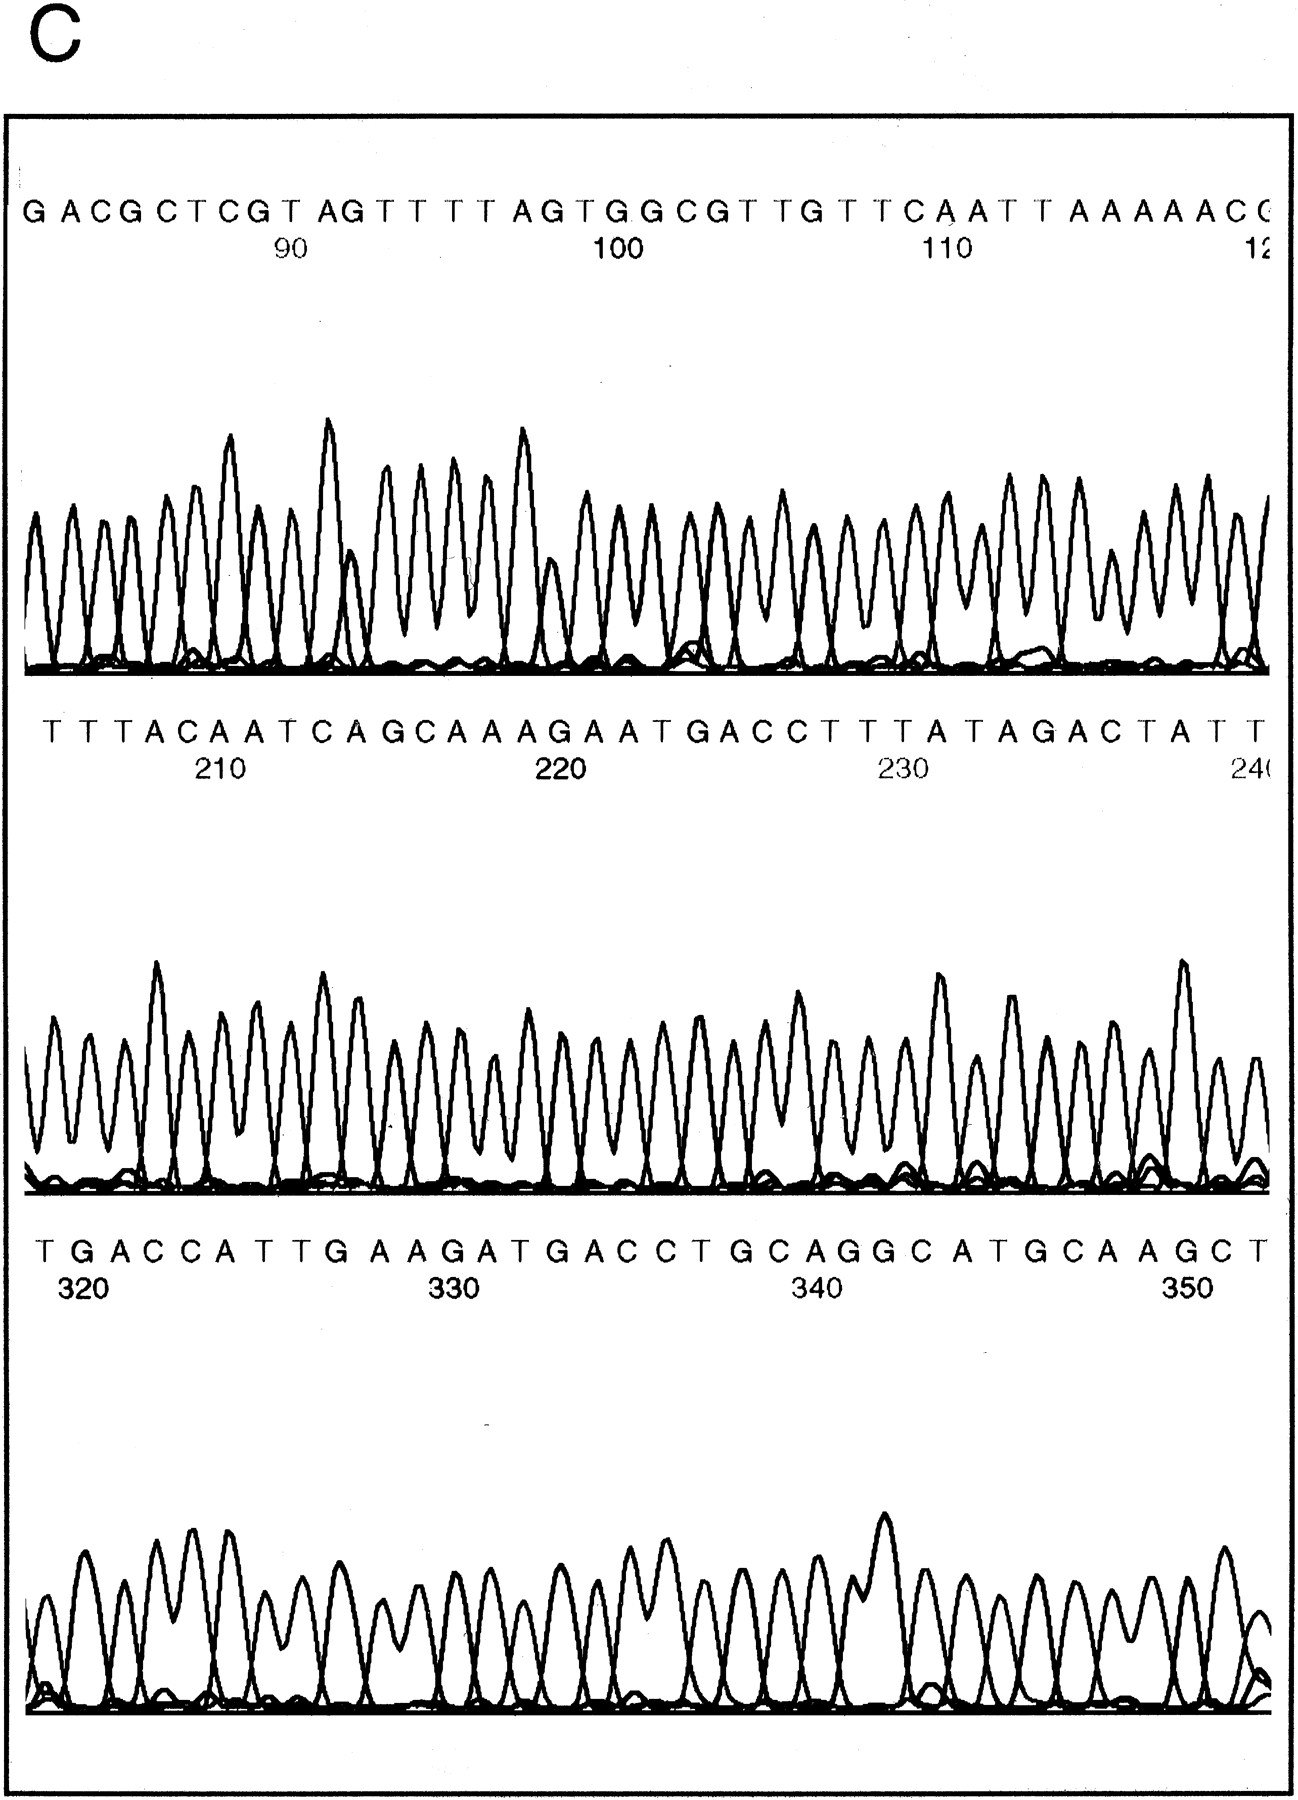
Sequence analysis of the F18E3 gap region. (A) The F18E3-10 plasmid insert is depicted along with the 39 transposon insertions used to recover the complete sequence. These 39 were chosen randomly from 62 that mapped to the insert region by PvuII mapping. The vertical arrows represent individual transposon insertions. Those facing downward are in the forward orientation (the same orientation as the selectable marker in the transposon), whereas those facing upward are in the reverse orientation. Several transposons are numbered for cross-referencing with the gel (in B). (B) Positional mapping of the transposon insertions. A subset of the transposons mapped is shown. A diagram is located under the figure to indicate the source of each fragment. The 0.9-kb fragment present in the recombinants represents the transposon, which is liberated from the plasmid upon digestion with EcoRI and NotI. The size of the fragment labeled “short” provides the distance of the transposon from the unique EcoRI site at the right end of the insert, whereas the fragment labeled “long” contains the vector and a variable amount of insert sequence. (M) λHindIII marker; (F) F18E3-10 potential plasmid. (C) Representative dye primer sequencing with a transposon recombinant template. Approximately 350–500 bases of high quality sequence data was obtained routinely with various primers.


