
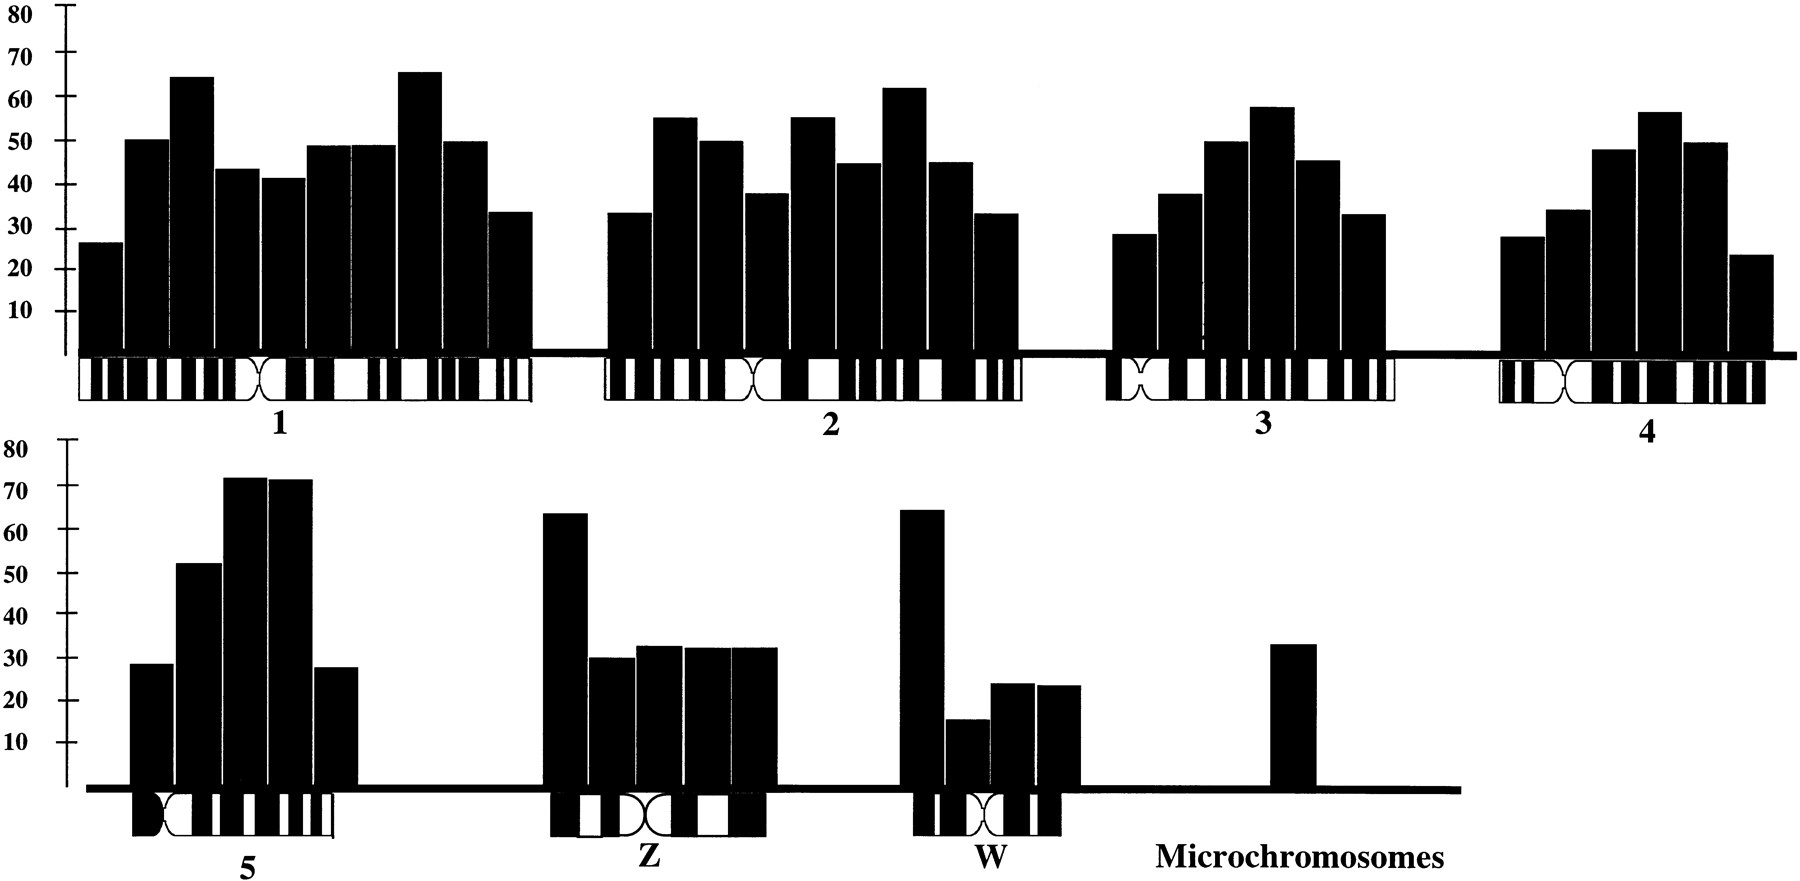
Quantification of PRINS (CA)10 hybridization to 40 chicken metaphase spreads. Signal intensities for the five largest chromosomes, the sex chromosome, and the microchromosomes as a whole were classified using a point system as either weak (0), average (+1), or strong (+2). These values were transformed into percentages for defined regions of each chromosome so that, e.g., a classification of average for a particular chromosomal region on all metaphases correlates to a value of 50%. Signals from the W chromosome are shown with the assumption that the bright signal on the end of one of the chromosomal arms was consistently from the end of the p arm (see text).


