
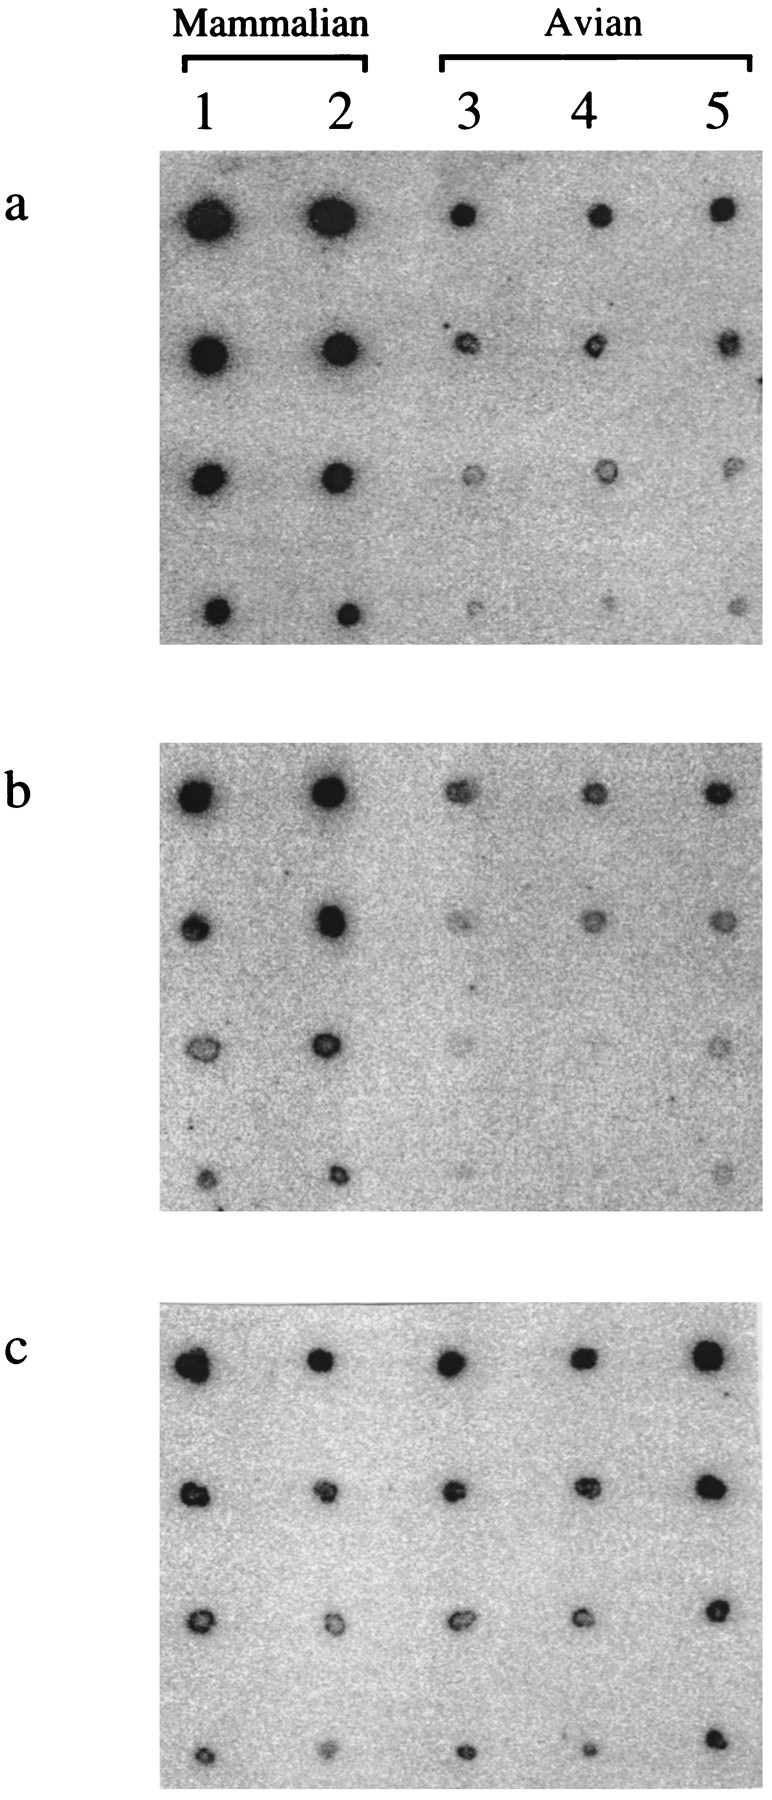
Figure 1.
Dot-blot hybridization signals of (CA)15 (a), (AAC)10 (b), and (AAGG)7 (c) to genomic DNA of human (1), pig (2), chicken (3), woodpecker (4), and swallow (5). Intensity ratio calculations from these filters suggested (CA)15 and (AAC)10 to be more common in the mammalian than in the avian genomes, whereas (AAGG)7 appeared to occur equally in all species (refer to Table 1). The uppermost dot on each filter contains 300, 280, 120, 120, and 120 ng of genomic DNA, respectively. The remaining three dots represent 50%, 25%, and 12.5% dilutions of the above concentrations. Different exposure times were used for the filters; therefore signal intensities between filters cannot be compared.


