
A Linkage Map of the Rat Genome Derived from Three F2 Crosses
Abstract
We report the construction of a dense linkage map of the rat genome integrating 767 simple sequence length polymorphism markers, combined over three crosses with high rates of polymorphism. F2 populations from WKY × S (n = 159), BN × S (n = 91), and BN × GK (n = 139) were selected and genotyped for combinations of microsatellite markers. The loci define 21 linkage groups corresponding to the 20 rat autosomal chromosomes and the X chromosome. The map spans a genetic length of 1998 cM. This combined linkage map should facilitate the advancement of genetic studies for a wide variety of rat models characterized for complex phenotypes.
A goal of biomedical research is to establish the genetic factors underlying multifactorial traits in humans, such as hypertension, diabetes mellitus, obesity, and neurological disorders. The genetic dissection of such complex phenotypes requires both a suitable population and a dense linkage map of the entire genome.
The rat is one of the most widely studied experimental animals in biomedical research and provides models for genetic diseases. In particular, many inbred strains of rat have been developed for either monogenic or multifactorial disorders, and segregating populations, such as an F2 or a backcross, are commonly used for a quantitative trait loci (QTL) approach to genetic mapping of multifactorial traits (Hilbert et al. 1991; Lander and Schork 1994;Galli et al. 1996; Gauguier et al. 1996; Gu et al. 1996; Moisan et al. 1996). However, despite extensive biochemical and physiological characterization, genetic resources for the rat have been lacking. Effort has been placed on rectifying this situation in past years with reports of partial genome maps of increasing density from several groups (Levan et al. 1990, 1991; Serikawa et al. 1992; Remmers et al. 1993; Jacob et al. 1995; Pravenec et al. 1996; Toyota et al. 1996) that have proved very powerful for localization of disease loci. Higher resolution genetic maps are required for the analysis of congenic lines to obtain more precise localizations ultimately leading to the identification of some of these disease-related genes. Physical mapping resources are being constructed for the rat (Cai et al. 1997), and a high-resolution genetic map will help to anchor the physical and transcript maps.
We present here a genetic linkage map of the rat with simple sequence length polymorphisms (SSLPs) combined over three crosses and integrating 767 markers. The crosses were specifically selected for high polymorphism rate to ensure entire genome coverage with a maximum of informative markers. We have mapped three F2 populations, which is an efficient strategy for map construction given the underlying low polymorphism rate in interstrain rat crosses. The markers define 21 linkage groups corresponding to the 20 autosomal and X chromosomes. The combined map spans a total genetic length of 1998 cM (Kosambi 1943) and includes 233 microsatellites identified in gene sequences. Some 448 loci were ordered with odds of 1000:1 or greater in the combined map produced by the Multimap program (Matise et al. 1994), and these are considered to be “anchor loci.”
RESULTS
A collection of simple sequence repeats (SSRs) of di-, tri-, or tetranucleotides was obtained, either by sequencing random short genomic clones or by screening GenBank to find SSRs in gene sequences. Some 420 primer pairs were designed from positive clones, 380 from gene SSRs. Of the latter markers, 123 were included in our previous map (Serikawa et al. 1992), which was the first SSR-based genetic map of the rat. In tests for amplification, 600 markers (75%) displayed a clear PCR product of the expected size. A second collection of 372 markers published previously (Jacob et al. 1995) was also studied. Of these, 337 displayed a PCR product under our standard conditions. The PCR assays were characterized for allele sizes on a panel of 28 inbred rat strains that we and others have used in experimental crosses for the mapping of multifactorial traits. These traits include hypertension [both spontaneously hypertensive (SHR) and stroke-prone spontaneously hypertensive (SHRSP) strains from different colonies, Milan hypertensive (MHS), Lyon hypertensive (LH), and John Rapp salt-sensitive (SS/JR) rats], non-insulin-dependent diabetes mellitus [Goto Kakisaki diabetic (type 2) (GK)], polycystic kidney disease (PKD), and hyperactivity [Wistar Kyoto hyperactive (WKHA)]. Table 1 (available on http:http://www.cshl.org/gr) shows the genetic heterogeneity among different colonies within the same strain and between different strains (polymorphism rate). Of the newly characterized markers, 80% are SSLP markers. As expected, inbred strains with the same name but from different colonies display low rates of polymorphism (10%–20%), except for Wistar Kyoto (WKY) rats, which exhibit considerable variability (13%–40%). Only 48% of the markers share the same allele in WKY rats from the seven different colonies tested. This genetic diversity could be explained by the fact that the original strain did not attain complete homozygosity before being distributed to different laboratories. Table 2 shows the polymorphism rate for each inbred line averaged over the remaining 27 lines for two sets of markers derived from random clones: Wox and Mit/Mgh (Jacob et al. 1995). The Wox set is more informative for crosses involving WKY, SHRSP, and SHR strains, whereas the Mit/Mgh set is more informative for the remainder. Again we see the variability between the WKY strains: For example, the Wox markers are generally ∼10% more informative for WKY HEID than for WKY RAPP crosses.
Mean Polymorphism Rate for Inbred Strains of Rat in Wox and Mit/Mgh Markers Derived from Random Clones
Intercrosses between WKY and S, BN and S, and BN and GK were chosen for mapping because of the high rate of heterogeneity they displayed from polymorphism assays: 72.4%, 75.1%, and 82.1%, respectively. To increase the accuracy and density of the mapping, SSLPs were typed in three large pedigrees of at least 91 progeny from F2intercrosses. Some 415 SSLPs were genotyped in the WKY × S cross (n = 159), 474 in the BN × S cross (n = 91), and 520 in the BN × GK cross (n = 139), and a linkage map was constructed for each cross by multipoint analysis. When anonymous markers were found to be cosegregating, DNA sequences from the corresponding random clones were compared, and five duplicate markers were identified. In some instances (D20Mgh2, D18Mgh4, D3Mgh7), PCR primer pairs amplified two systems of different size that do not cosegregate. They have been designated as H (high) and L (low). Full information on the three maps, including primer sequences and PCR conditions, is available fromhttp://www.well.ox.ac.uk/pub/genetics/ratmap.
The mapping of 129 genetic markers on three crosses and 311 on two crosses provided enough anchor loci to produce a single combined map that includes 511 anonymous markers and 233 gene loci (Table 3). The chromosome 1 map may be found herein (Fig. 1) and the remainder onhttp://www.cshl.org/gr andhttp://www.well.ox.ac.uk/pub/genetics/ratmap.
Statistics on the Distribution of Markers in the Rat Genetic Linkage Maps Combined Over the Crosses WKY × S, BN × S, and BN × GK
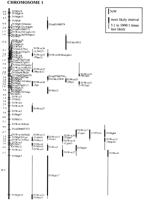
Genetic linkage map of rat chromosome 1 combined over the crosses WKY × S, BN × S, and BN × GK. Gene names (shown in parentheses) refer to loci taken from GenBank. Anchor loci were ordered with odds in support of 1000:1 or more. Lengths are in cM (Kosambi 1943). The orientation of the chromosome is arbitrary. Maps for the remaining chromosomes are located on http:http://www.cshl.org/gr andhttp://www.well.ox.ac.uk/pub/ genetics/ratmap.
DISCUSSION
We have succeeded in mapping 767 markers to the 21 chromosomes of the combined map derived from the three F2crosses. We have been very careful to check the genotyping of all markers thoroughly and to rescore or exclude ambiguous cases. The use of JoinMap software (Stam 1995; Stam and van Ooijen 1995) has facilitated the identification of dubious genotypes and focused attention on closely adjacent double recombinants for further verification. Such recombinants are usually indicative of scoring errors or mutations that can exaggerate genetic distance and affect the evidence for locus order. After data verification, no outlying multiple recombination events were detected using the error checking criteria described in Methods.
Although the order of published markers for each chromosome in our combined map generally accords well with that reported previously, the chromosome lengths differ. The total length of the combined map is 1998 cM, 2.5% greater than that estimated by Toyota et al. (1996) on a map based on RDA (representational difference analysis) markers and 25% longer than the SSLP map of Jacob et al. (1995). We compare, in Table3, statistics of our map with those published byJacob et al. (1995) because we have incorporated 337 Mit and Mgh microsatellite markers in our map. The genetic length of each of chromosomes 7, 9, 14, 16, 18, and X is considerably greater, which may be explained by the greater number of loci we have mapped (increasing from 28 to 46, 12 to 24, 14 to 25, 10 to 24, 15 to 33, 13 to 30, and 11 to 26, respectively). Although we have mapped only four new markers on chromosome 15, the genetic length has increased from 49 to 93 cM. This is largely because of the D15Mgh3–ETB interval, which is >20 cM in both the WKY × S and BN × GK crosses. Small increases in genetic length may be caused by recombination between markers that previously were found to be cosegregating when characterized on a small mapping panel (Jacob et al. 1995). This has been the case for several chromosomes: For example, on chromosome 3, DRFLP and D3Mgh13 previously were defined to be cosegregating with 10 other loci, and we have detected ∼2% recombination between these two loci. We have mapped ET3 at 4.5cM from D3Mgh10, whereas these two markers were reported to cosegregate (Jacob et al. 1995). The same feature was found on chromosome 4 for D4Mgh18, D4Mit16, and D4Mit17. On chromosome 10, D10Mit3 and D10Mit4, closely linked in the F2 map of Jacob et al. (1995), appeared to be loosely linked in our F2 combined map as in the recombinant inbred map (Pravenec et al. 1996).
The average spacing between anchor loci is 4.7 cM. The major improvements in resolution have been found on particular regions of the genome such as chromosomes 1, 2, 5, 6, 10, and 14 (Table 3). Chromosomes 15 and 20 still remain poorly covered. Interestingly, there is significant nonrandom distribution of microsatellite markers on many rat chromosomes (Table 3). This observation already has been reported in the human genetic map (Dib et al. 1996).
Chromosomal assignments for 13 markers (D1Mgh18, D3Mit5, D3Mit11, D5Mgh7, D5Mit8, D7Mgh8, D7Mit15, D9Mgh1, D10Mgh13, D14Mgh4, D19Mgh6, D19Mit1, D20Mit2) were found to be different from localizations reported previously (Jacob et al. 1995). Genotyping was repeated using a new batch of PCR primers purchased from Research Genetics Inc. and results confirmed our original data (D3Mit5 was redelivered as D17Mit8).
There was significant segregation distortion associated with markers on several chromosomes that remained after extensive data verification (χ2 > 10). The effect was most noticeable on chromosome 4 in the GK (female) × BN (male) cross where there was a deficiency of homozygotes in GK alleles at many loci spanning the chromosome. This effect is shown in Figure 2 as the absolute value for the deficiency of GK homozygotes at chromosome 4 anchor loci. The value is expressed as the proportion |(n 11 − n 22)/(n 11 + n 22)|, where n 11 is the number of homozygotes for the GK allele and n 22 is the number of homozygotes for the BN allele. One possible explanation would be the existence of a genetic factor on chromosome 4, in the region of D4Wox22, which affects the differential viability of rats. However, two loci, D4Mgh21 and D4Mgh13, at one end of the chromosome, showed a complete absence of homozygotes for the GK allele that could not be attributable to fully penetrant viability loci because the inbred GK line is homozygous at these loci.
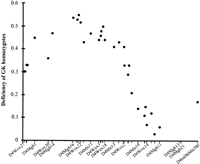
Relationship between deficiency of homozygotes for the GK allele and map position of anchor loci on chromosome 4. Note that D4Mgh21 and D4Mgh13 at one end of the chromosome, which show a complete absence of homozygotes for the GK allele, are off the scale (see text for details).
The genetic linkage map of the rat reported here provides an important tool for the full use of the rat as a model for genetic studies of complex traits. The inclusion of 233 gene markers will help to improve the comparative map of the rat with other species. The framework map of 448 markers with average spacing of 4.7 cM between adjacent markers defines anchor loci that can be used in further mapping studies with the ultimate goal of completing a high-density genetic and physical map of the rat genome incorporating polymorphic markers, expressed sequence tags, and other sequence-tagged sites.
METHODS
Generation of Simple Sequence Repeats
Short-insert libraries from WKY (Heidelberg) and SHRSP (Heidelberg) genomic DNA were constructed using a complete digestion with AluI, HaeIII, and RsaI. Fragmented DNA was cloned into the HincII site of the EMBL18 plasmid. The product of ligation was transformed into DH5 α competent cells (GIBCO-BRL) that were plated at a density of 1000–2000 clones/150 cm2. Clone lifts were hybridized with radioactive end-labeled di-, tri-, and tetraoligonucleotides: (CA)15, (GA)15, (AGG)10, (AGC)10 and (AGAT)8, (ATCC)8 and (AAGG)8, (ACAG)8 and (ACAT)8. Positive clones were selected and inoculated in 1.5 ml cultures. After plasmid DNA extraction, cycle sequencing of plasmid DNA was performed with an ABI 373A DNA sequencer (Applied Biosystems).
PCR primers flanking the repeats were selected using the OLIGO.4 computer program (National Biosciences Inc.) for their melting temperature (range 60–65°C) and the absence of dimer or significant secondary structure, in order to generate a PCR product of 100–300 bp. PCR primers were synthesized commercially by Genosys.
Genotype Determination
Genotyping was performed by PCR on progeny of BN × S (n = 91), WKY × S (n = 159), GK × BN (n = 64), and BN × GK (n = 75) reciprocal crosses. The reaction volume was 20 μl containing 50 ng of genomic DNA, 0.25–0.75 μm of each primer, 45 mm Tris (pH 8.8), 11 mm(NH4)2 SO4 (pH 8.8), 1.5 mmMgCl2, 6.7 mm β-mercapto-ethanol, 4.5 μm EDTA, 65.2 μm each of dATP, dCTP, dGTP, and dTTP, and 0.4 units of Taq DNA polymerase (Perkin Elmer). Thermocycling was initiated by 4 min of denaturation and followed by a touch-down protocol from 60°C to 55°C or 55°C to 50°C (James et al. 1994). PCR products were separated by electrophoresis on standard denaturing polyacrylamide gels and transferred to positive-charged nylon membrane (Pall). The membranes were hybridized with a primer labeled with [α-32P]dCTP using terminal transferase (Boerhinger). Genotypes were determined after autoradiography.
Map Construction
Prior to linkage analysis, JoinMap version 2.0 (Stam 1995; Stam and van Ooijen 1995) was used to calculate single factor segregation ratios for each marker in a linkage group. The genotypes were checked for all individuals at markers that were exhibiting significant distorted segregation. Subsequently, initial maps were created and double recombination events were identified with JoinMap and the data corresponding to these were verified. The JoinMap module for genotype checking calculates for all loci and for all individuals the probability of obtaining the present genotype, conditional on both the genotypes at the two flanking loci and on map distances. We considered unexplained genotypes to be those having a threshold of >3 for the test statistic of log10(1/p). For the GK × BN and BN × GK reciprocal crosses, the genotype data for each marker locus for the two populations were combined after testing the pairwise recombination frequencies for heterogeneity by χ2, again using JoinMap. The final maps were created using GMS (Lathrop and Lalouel 1984): This program identifies the maximum likelihood solution providing a framework of anchor loci which are ordered on the map with odds in support thereof of 1000:1 or more. Recombination frequencies between pairwise loci were checked for heterogeneity between crosses using JoinMap to identify potentially problematic loci, and further data verification was undertaken. A few markers that exhibited significant heterogeneity in placement were removed, and combined maps constructed with JoinMap and GMS. Further confirmation for the maps was obtained with the Multimap program (Matise et al. 1994). The maps shown in Figure 1 are those obtained with Multimap.
Acknowledgments
We thank V. Parent, J. Browne, and S. Keil for their technical assistance. This work was supported by the Wellcome Trust and the European Union “EUROHYPGEN” program. G.M. Lathrop holds a Wellcome Trust Principal Fellowship.
The publication costs of this article were defrayed in part by payment of page charges. This article must therefore be hereby marked “advertisement” in accordance with 18 USC section 1734 solely to indicate this fact.
Footnotes
-
↵4 Corresponding author.
-
E-MAIL marie-therese.bihoreau{at}well.ox.ac.uk; FAX (44) 1865 742 187.
-
- Received December 2, 1996.
- Accepted March 24, 1997.
- Cold Spring Harbor Laboratory Press


