
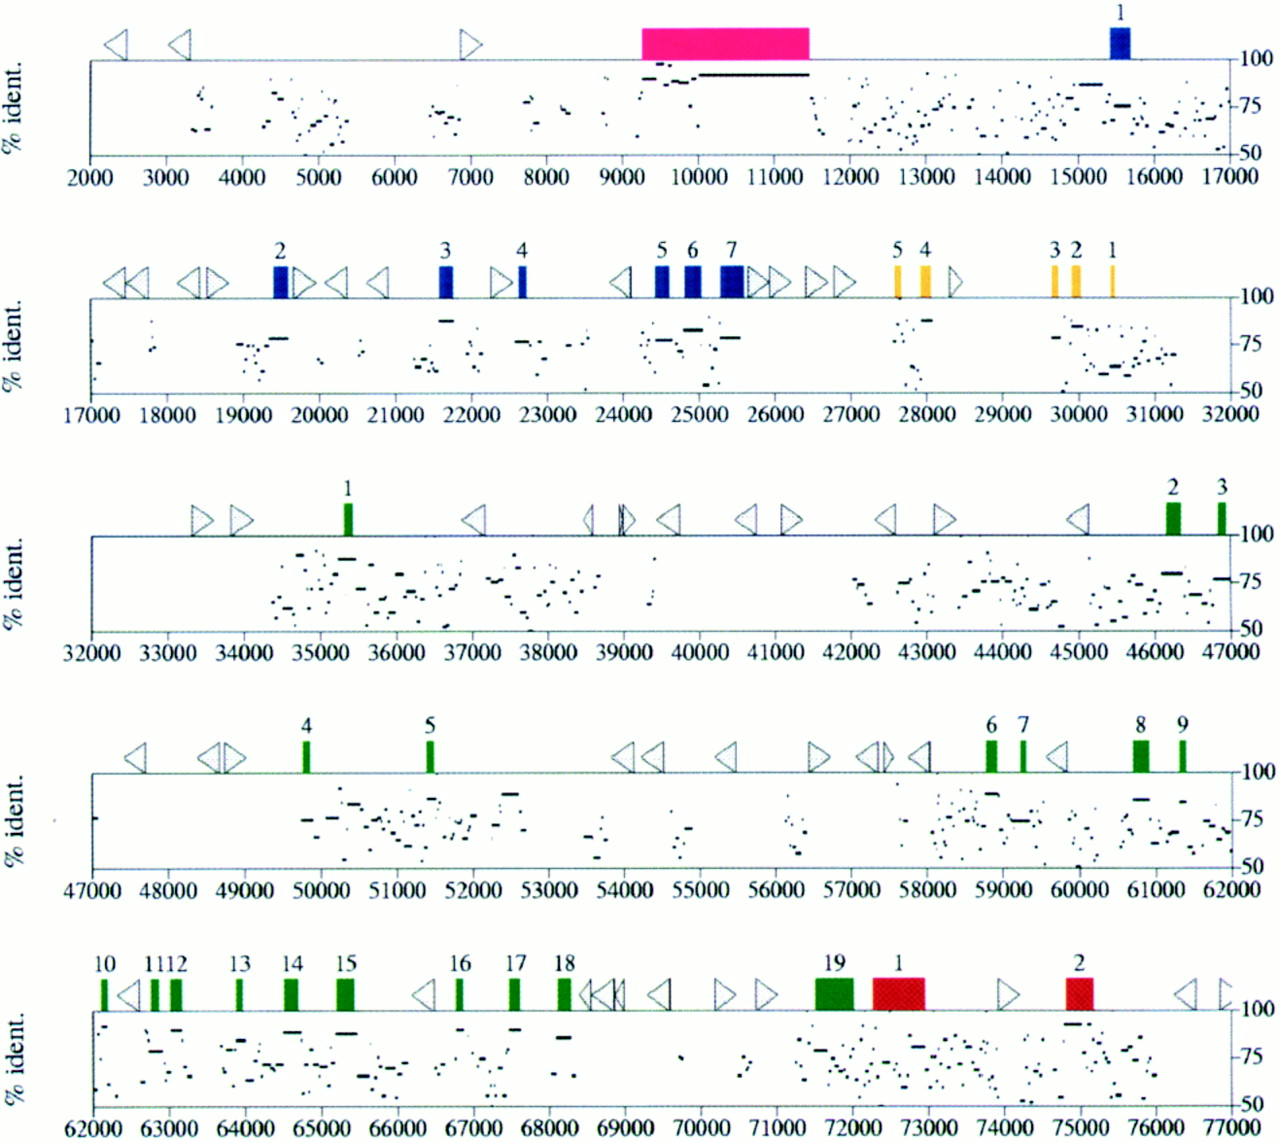
Figure 2.
Identity plot of the sequence in the BTK region. The mouse and human genomic sequence were aligned with SIM and the identity between the conserved segments are displayed in relation to the human sequence by a modified version of LAPS. As in Fig. 1, individual exons are represented by coloration. Exon numbers are displayed above the exon blocks. Triangles represent the location and orientation of the humanAlu repetitive elements in the region.


