
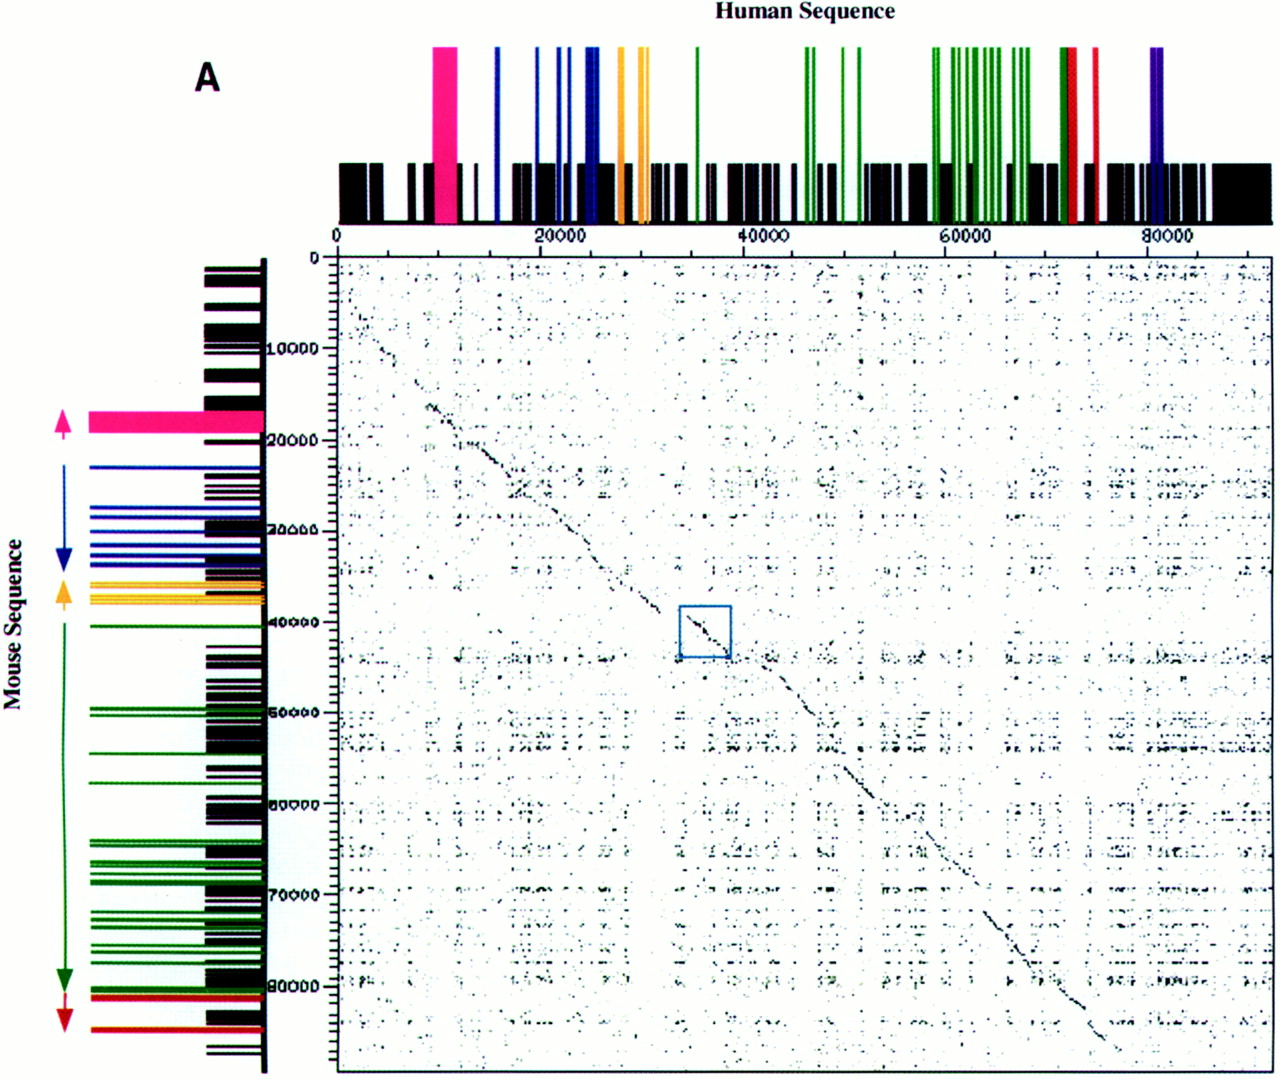
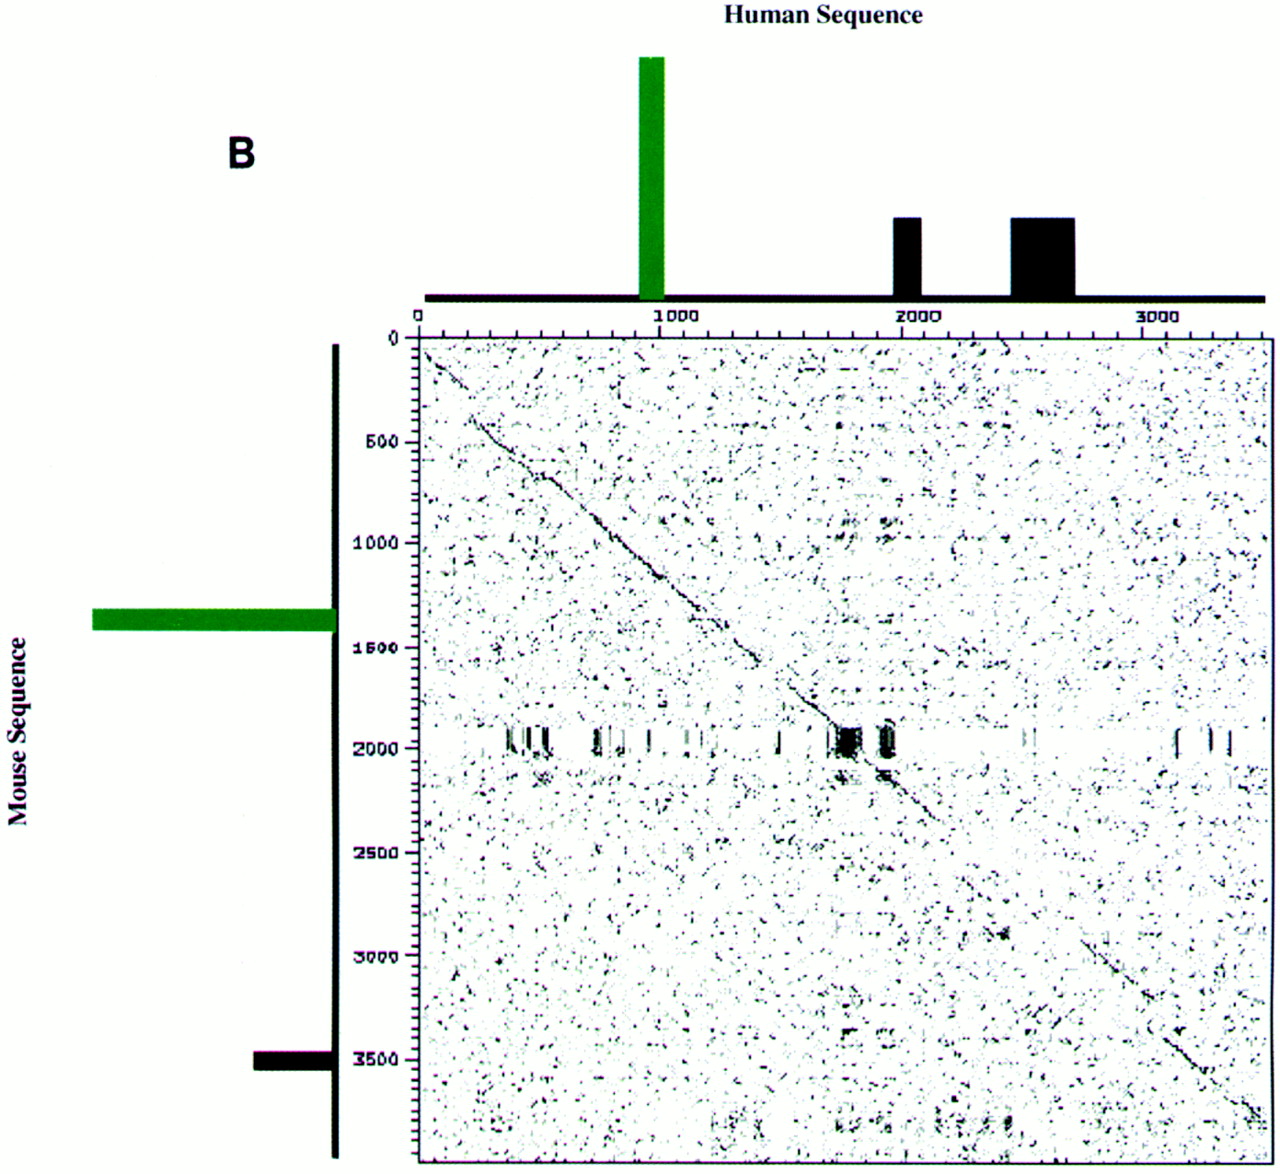
DOTTER dot matrix comparisons of human and mouse sequence in the BTK region. (A) Comparison of the entire genomic sequence in the region. Conservation in the dot blot is represented on a gray scale with black dots representing the highest conservation. Each axis has a graphical representation of the corresponding sequence in which all sizes are relative to each other and between species. Black bars represent all repeat sequences found. Individual exons are represented by coloration. Fuchsia represents FTP-3, blue represents α-d-galactosidase A, orange represents the L44L ribosomal gene, green represents BTK, red represents FCI-12, and purple represents the sequence with similarity to the L21 ribosomal gene. Direction of transcription is indicated by arrows on the mouse sequence and is the same for the human sequence. The region boxed in light blue is expanded in B and represents the conserved region flanking the first exon of BTK (green) complete with repetitive elements (black boxes) in both mouse and human.


