
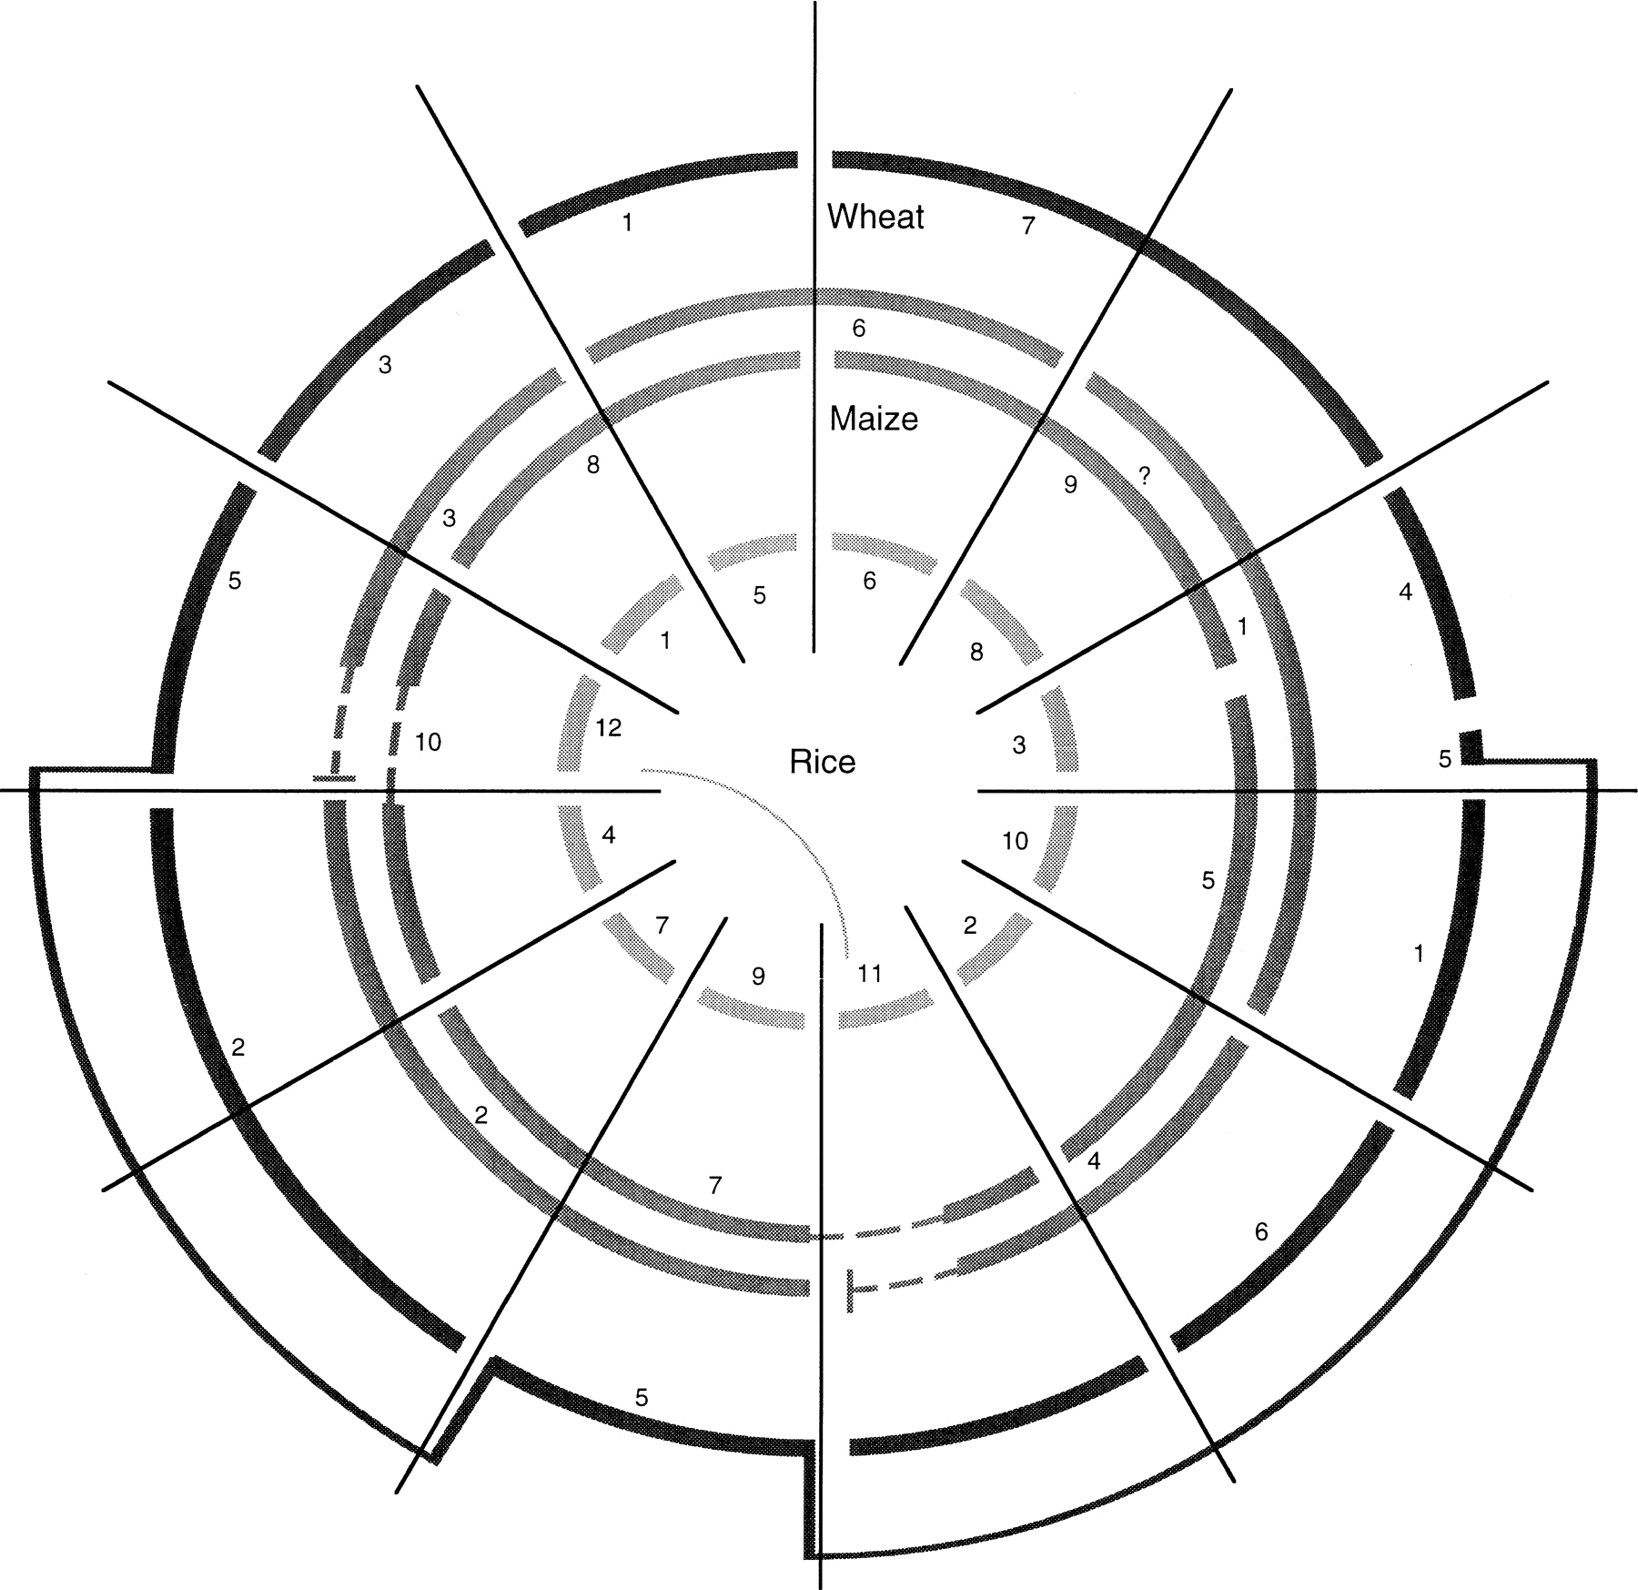
Figure 1.
A simplified comparative map of rice, maize, and wheat. Chromosomes are represented by arcs, and the number below each arc indicates the chromosome number. The wheat genome used as reference is the D genome of bread wheat. Maize is represented by two concentric series of arcs because it is actually an ancient tetraploid. Inversions are not shown. The broken lines indicate regions duplicated in rice (on chromosomes 11 and 12; see connecting curved line) that are not duplicated in maize. (Modified, with permission, from Moore et al. 1995a. Copyright 1995 Current Biology, Ltd.)


