

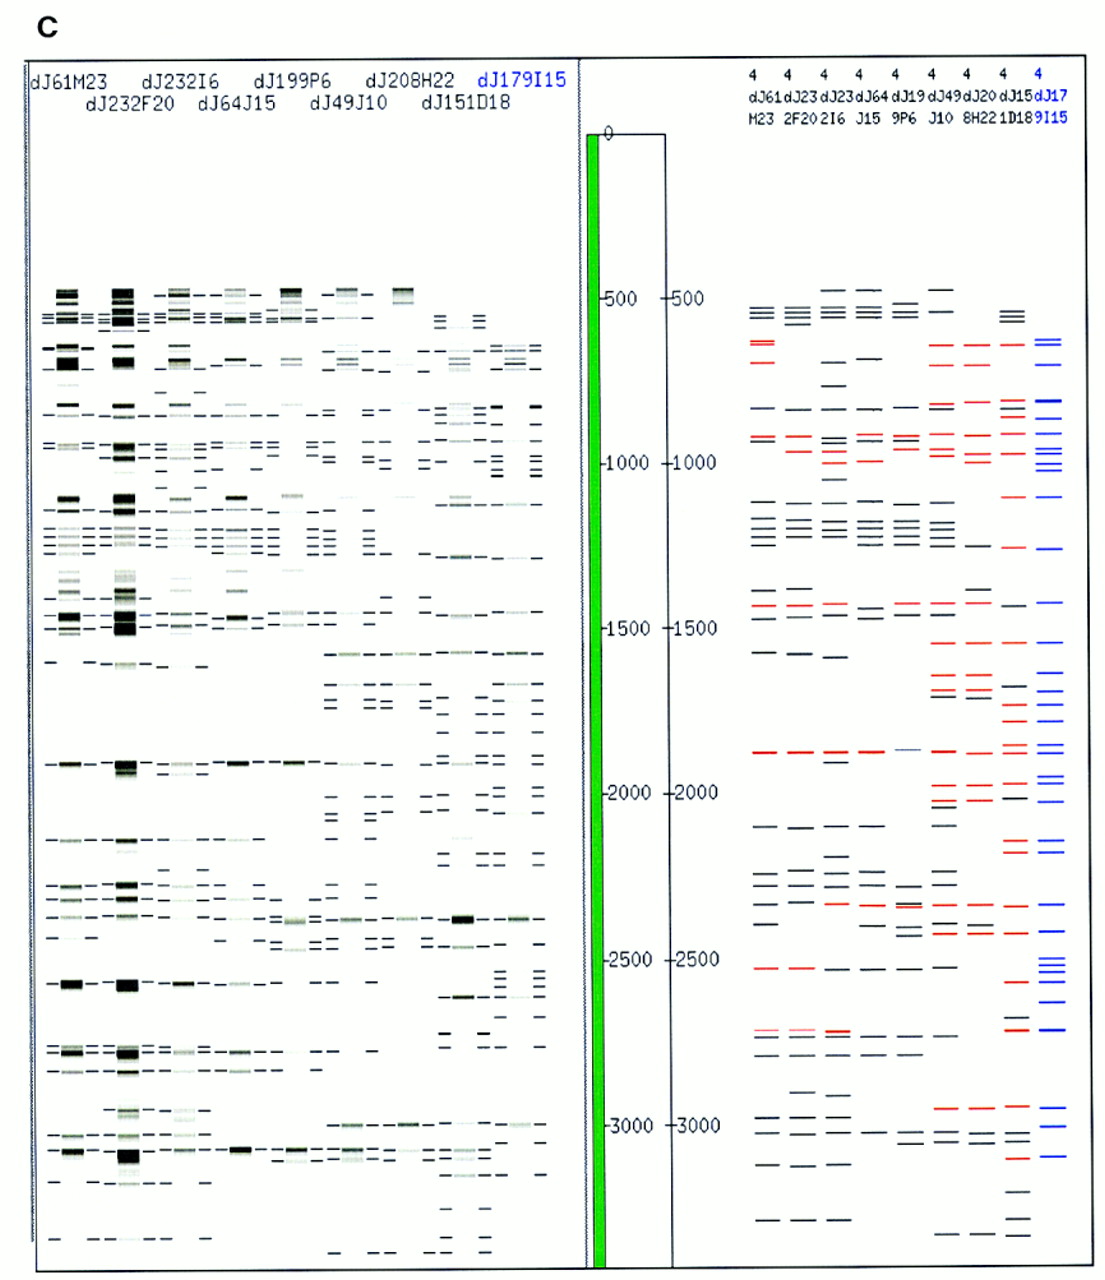
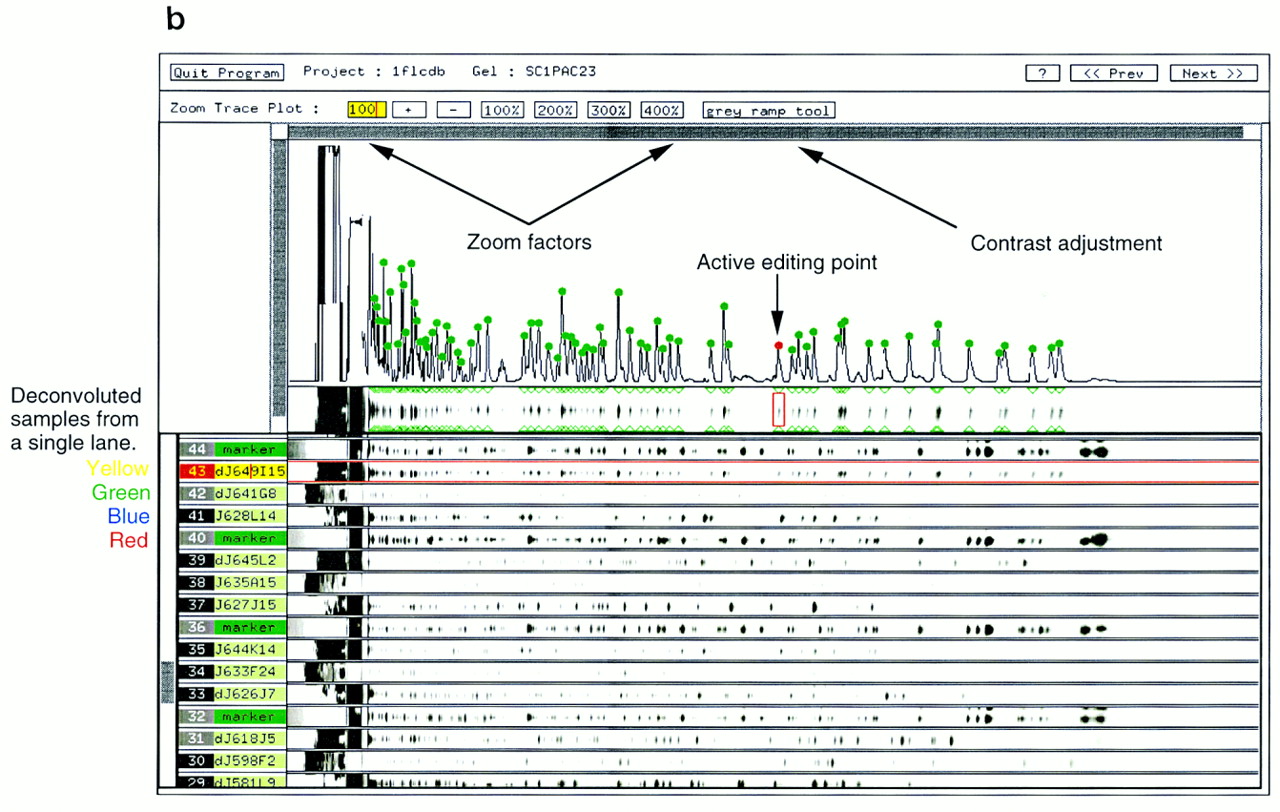
Figure 2.
Fluorescent fingerprint electrophoresis data, entry, and analysis. (a) The gel image of a fluorescent fingerprint gel (ABI Prism GeneScan Analysis 2.0.2). The 32-lane gel contains three clones in each well, giving a present capacity of 96 clones per run. We are updating our collection of software to double the number of lanes per gel. (b) Editing of fingerprint bands using Image3.(c) Digitized images of gel traces and corresponding fingerprints in FPC.


