
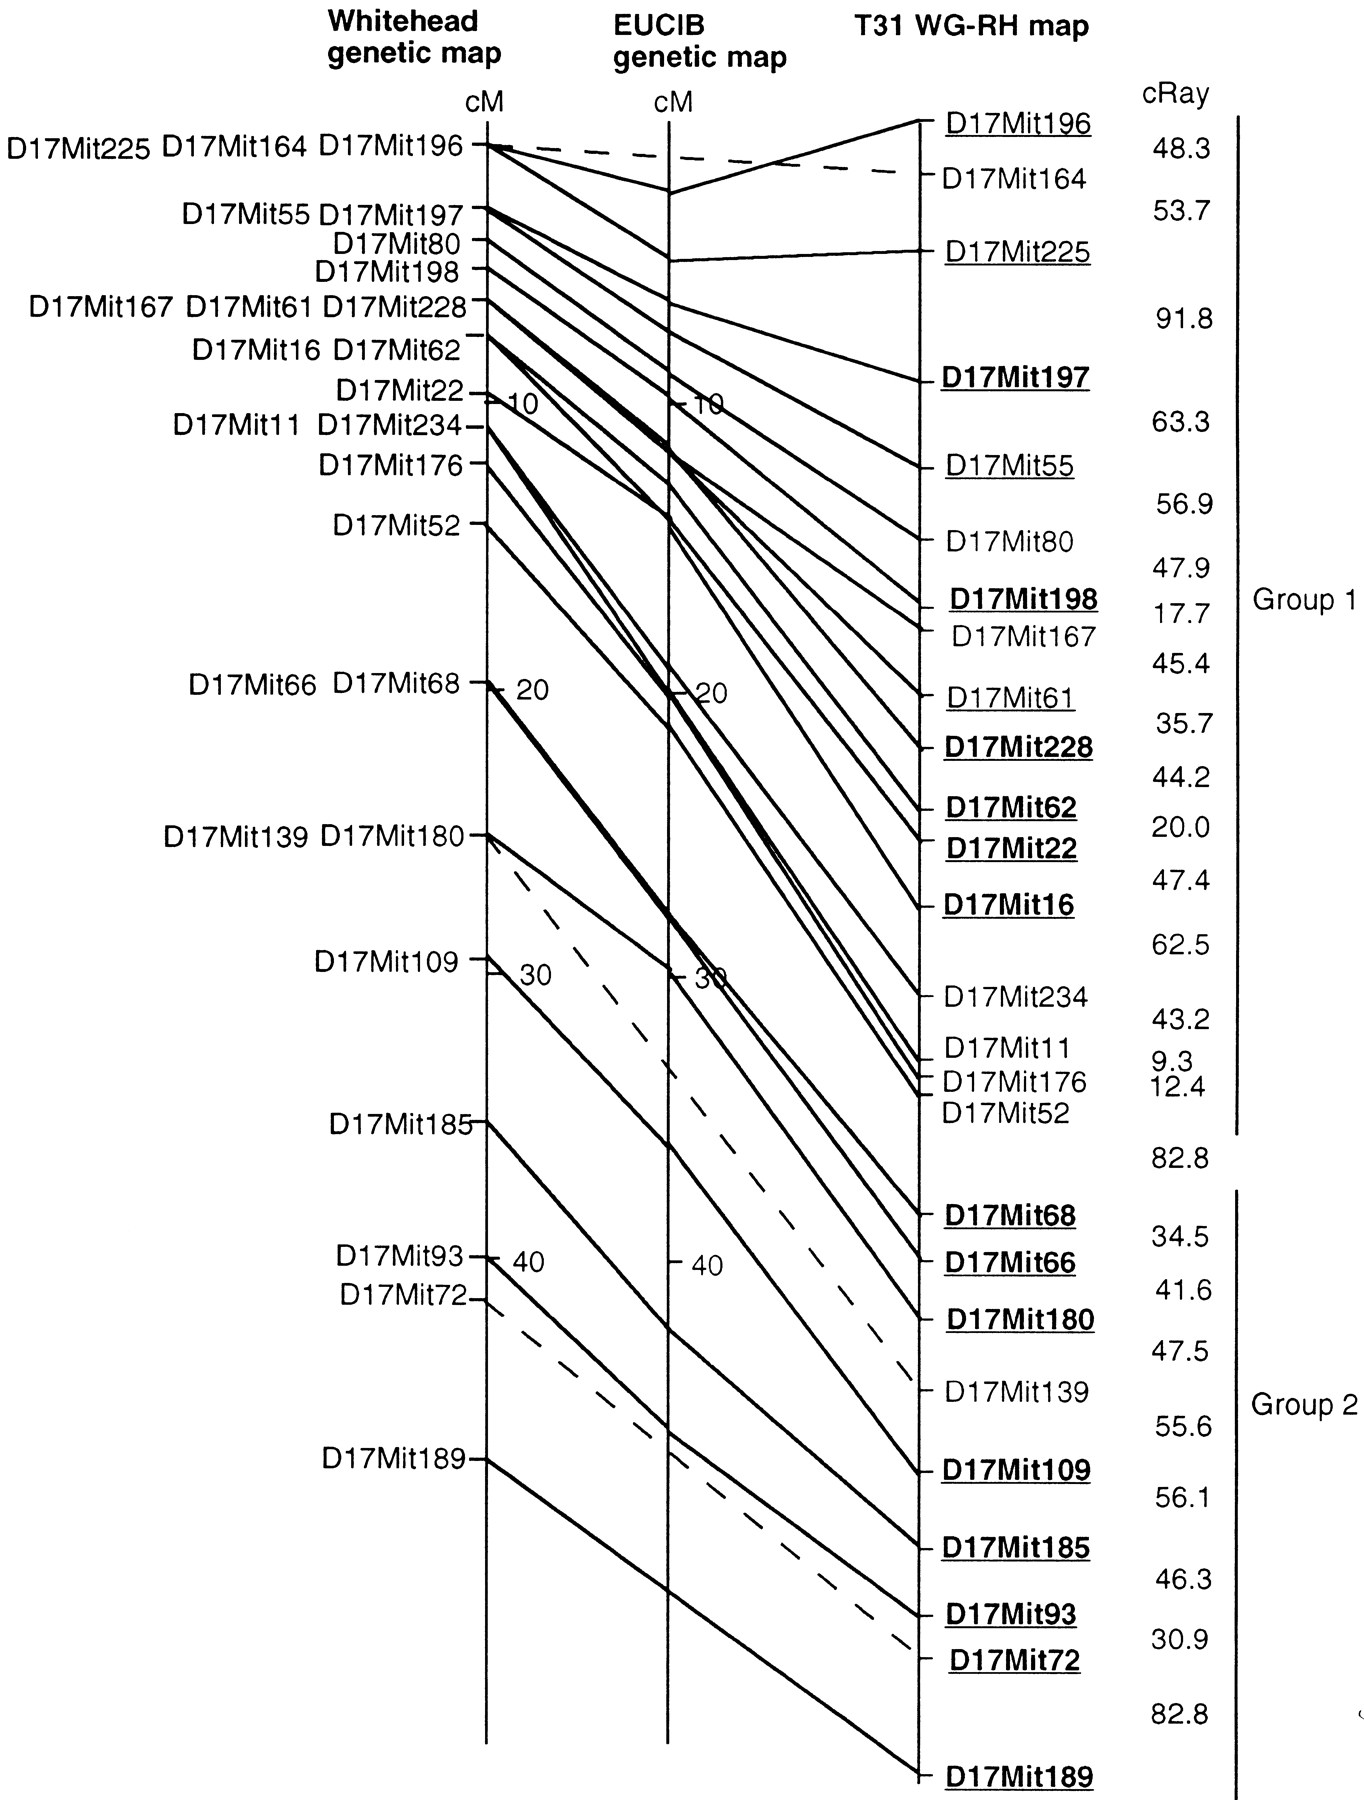
Figure 3.
Chromosome 17 WG–RH map. The 26 markers were analyzed in two groups to generate a high confidence map. Framework markers ordered with >1000:1 odds are represented in bold and underlined. Markers ordered with >100:1 odds are underlined and in plain type. The 82.8 cR distance between the two map groups was derived by analysis of the data as a single set. The Whitehead and EUCIB genetic maps are included for comparison. Unbroken lines connect markers localized on all three maps. Broken lines connect markers placed on the Whitehead and T31 maps that are not localized on the EUCIB map.


