
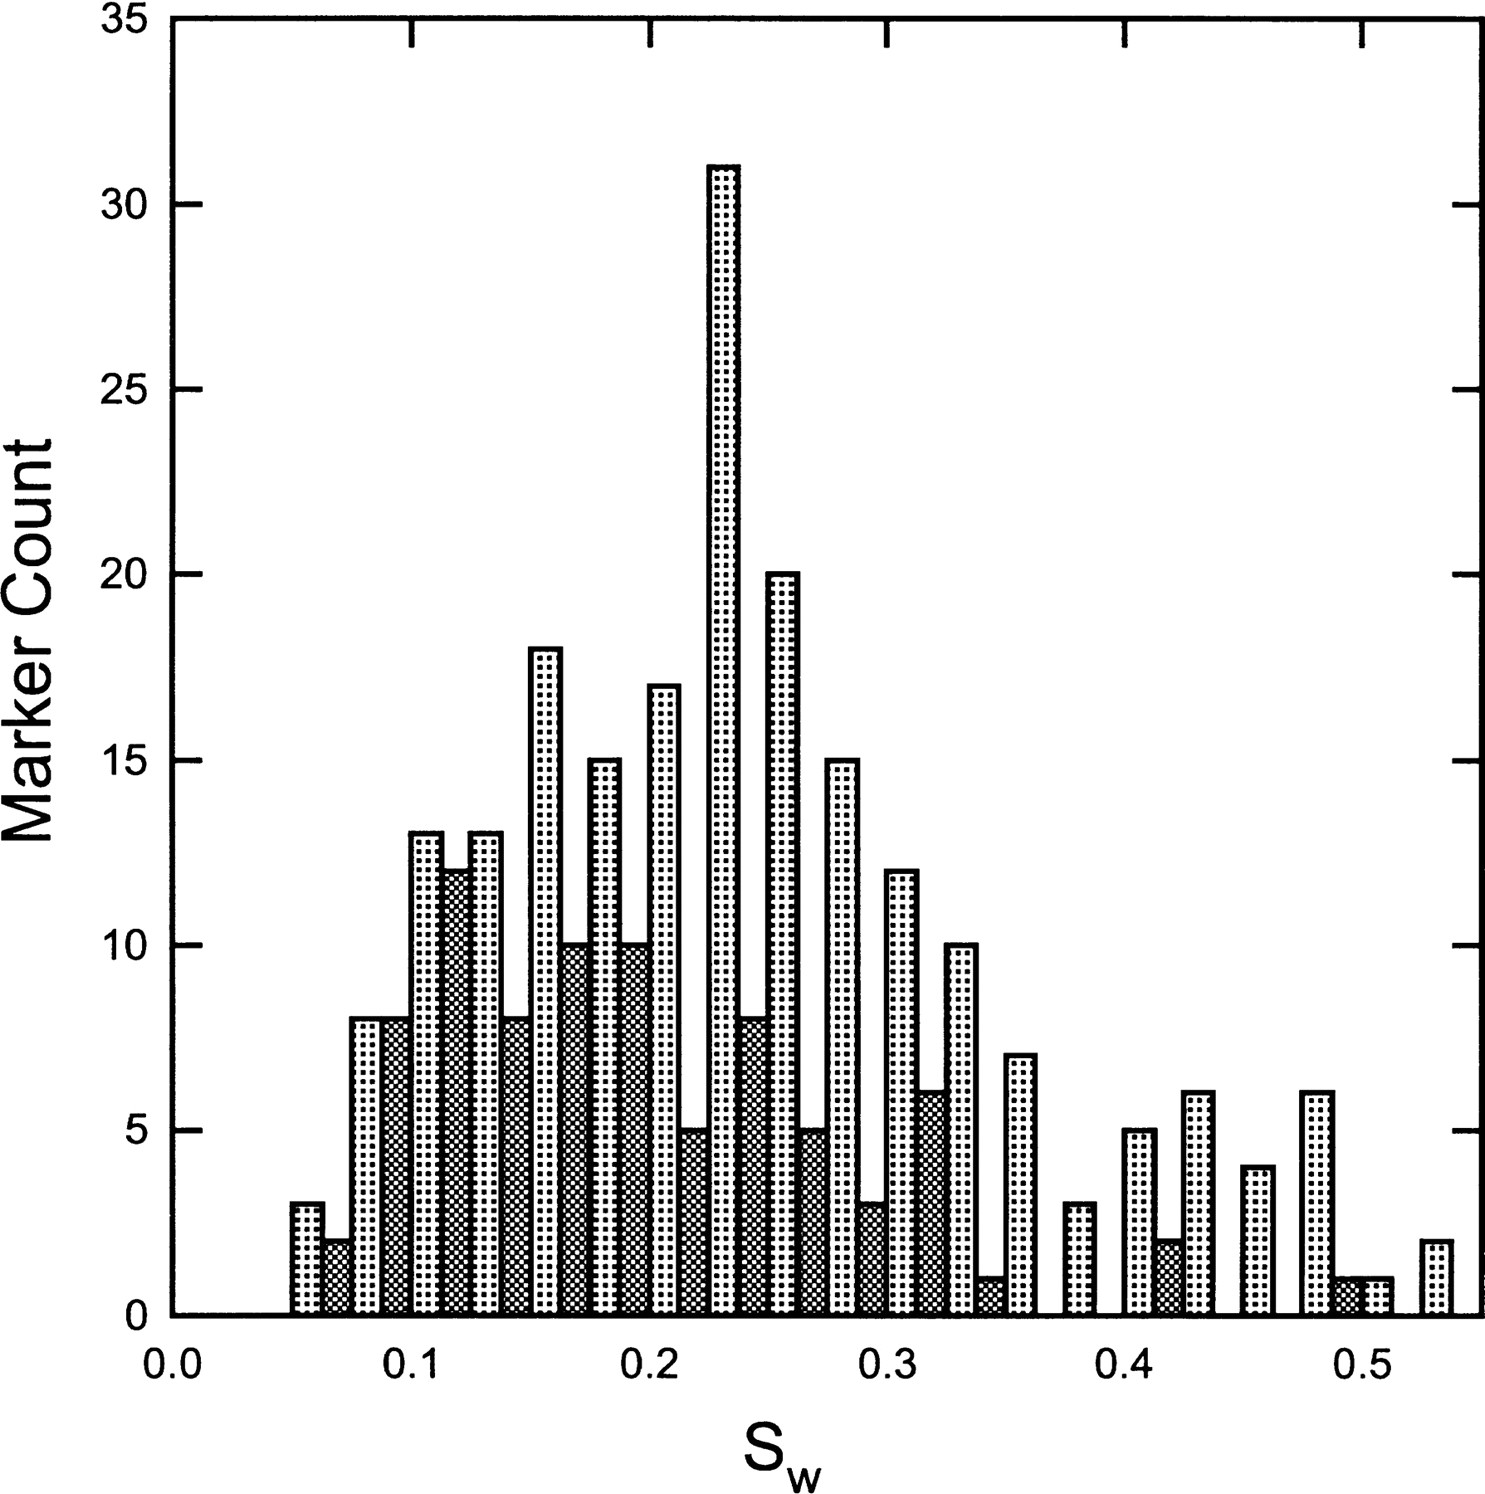
Figure 2.
Histogram representing standard deviations, Sw for all di- and tetranucleotide markers tested. Light shaded bars represent dinucleotide repeats and dark shaded bars represent tetranucleotide repeat markers.


