
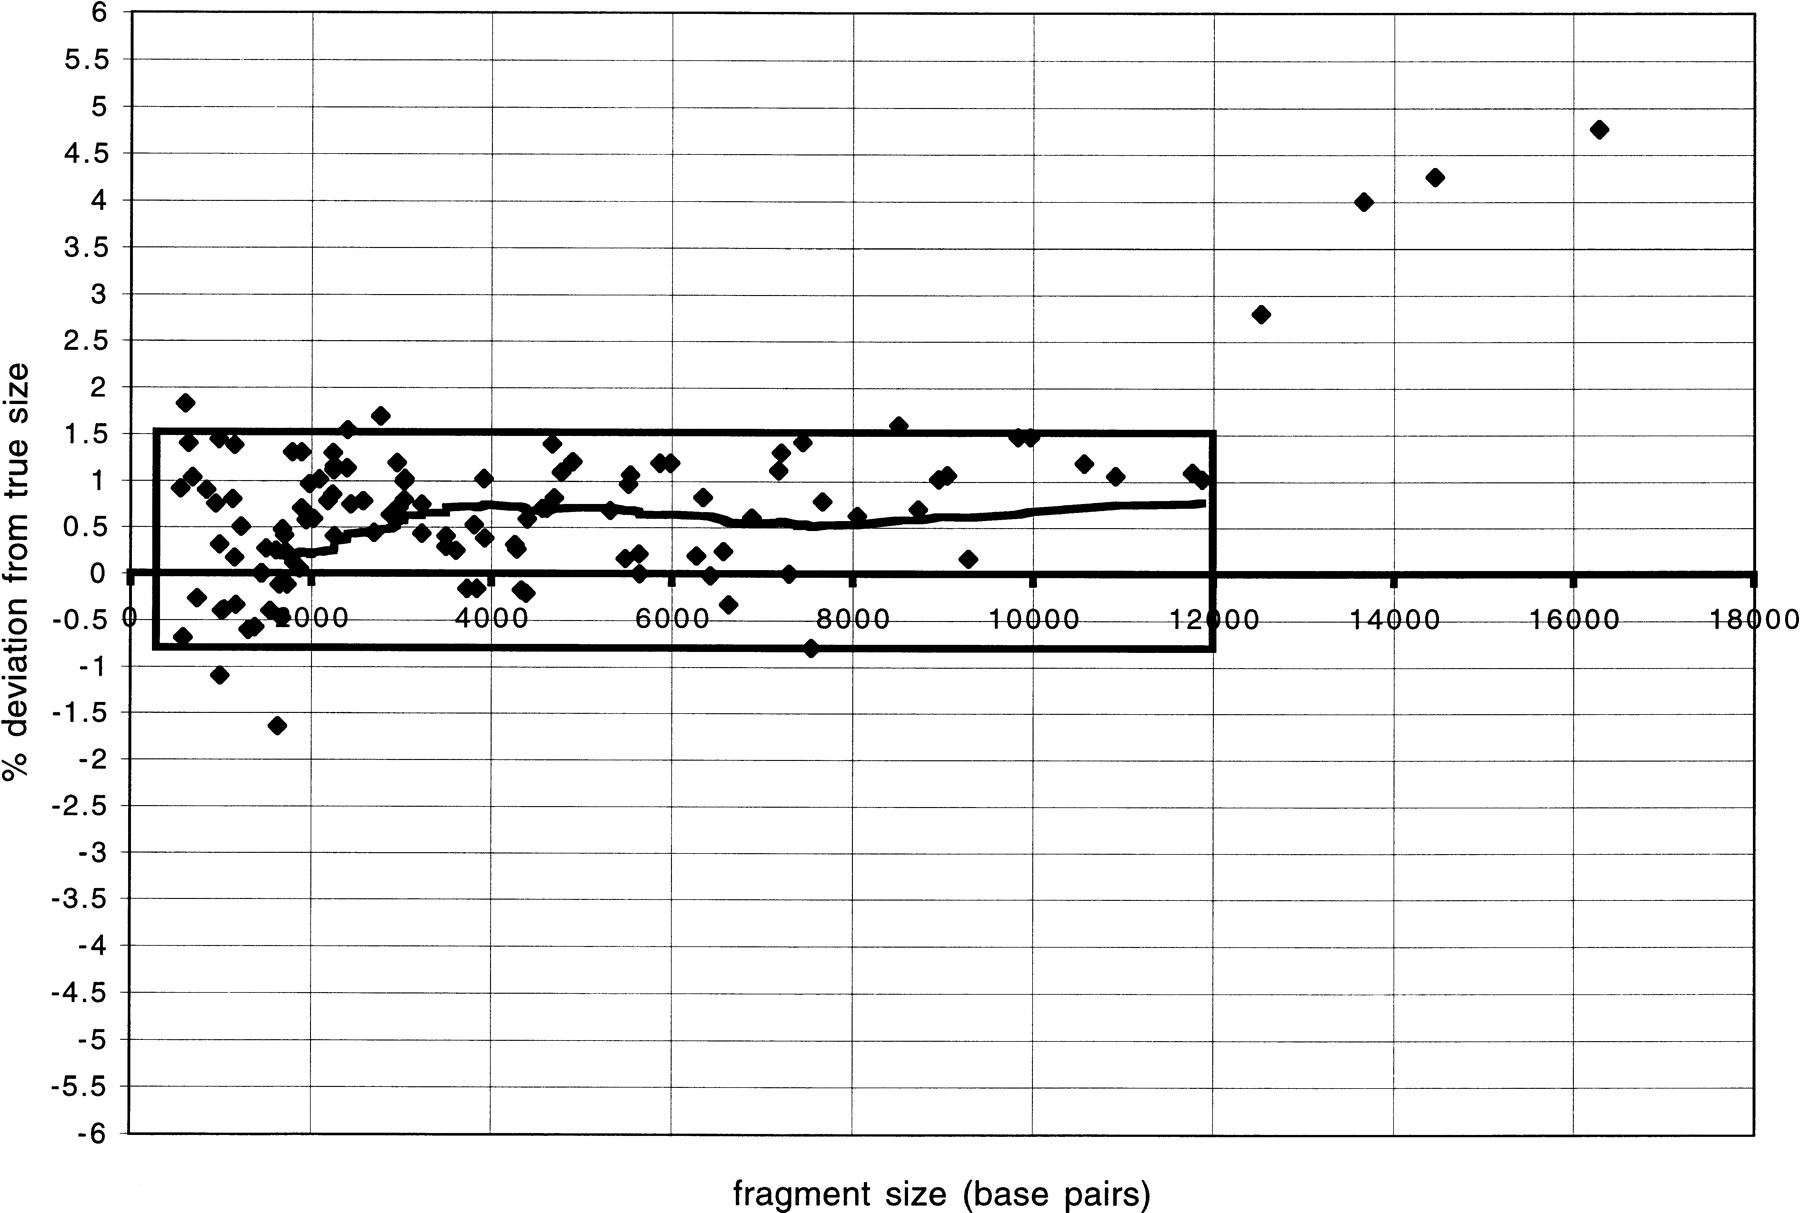
Figure 3.
Graph showing accuracy of restriction fragment sizes. On the yaxis “% deviation from true size” is the size, in base pairs, predicted from agarose gel analysis divided by the size of the restriction fragment as determined from sequence analysis of the entire clone, converted to a percent value. The line indicates a moving average calculated at data-point intervals of 40. The box encases 95% (102 of 107) of the data points for fragments of <12 kilobases.


