
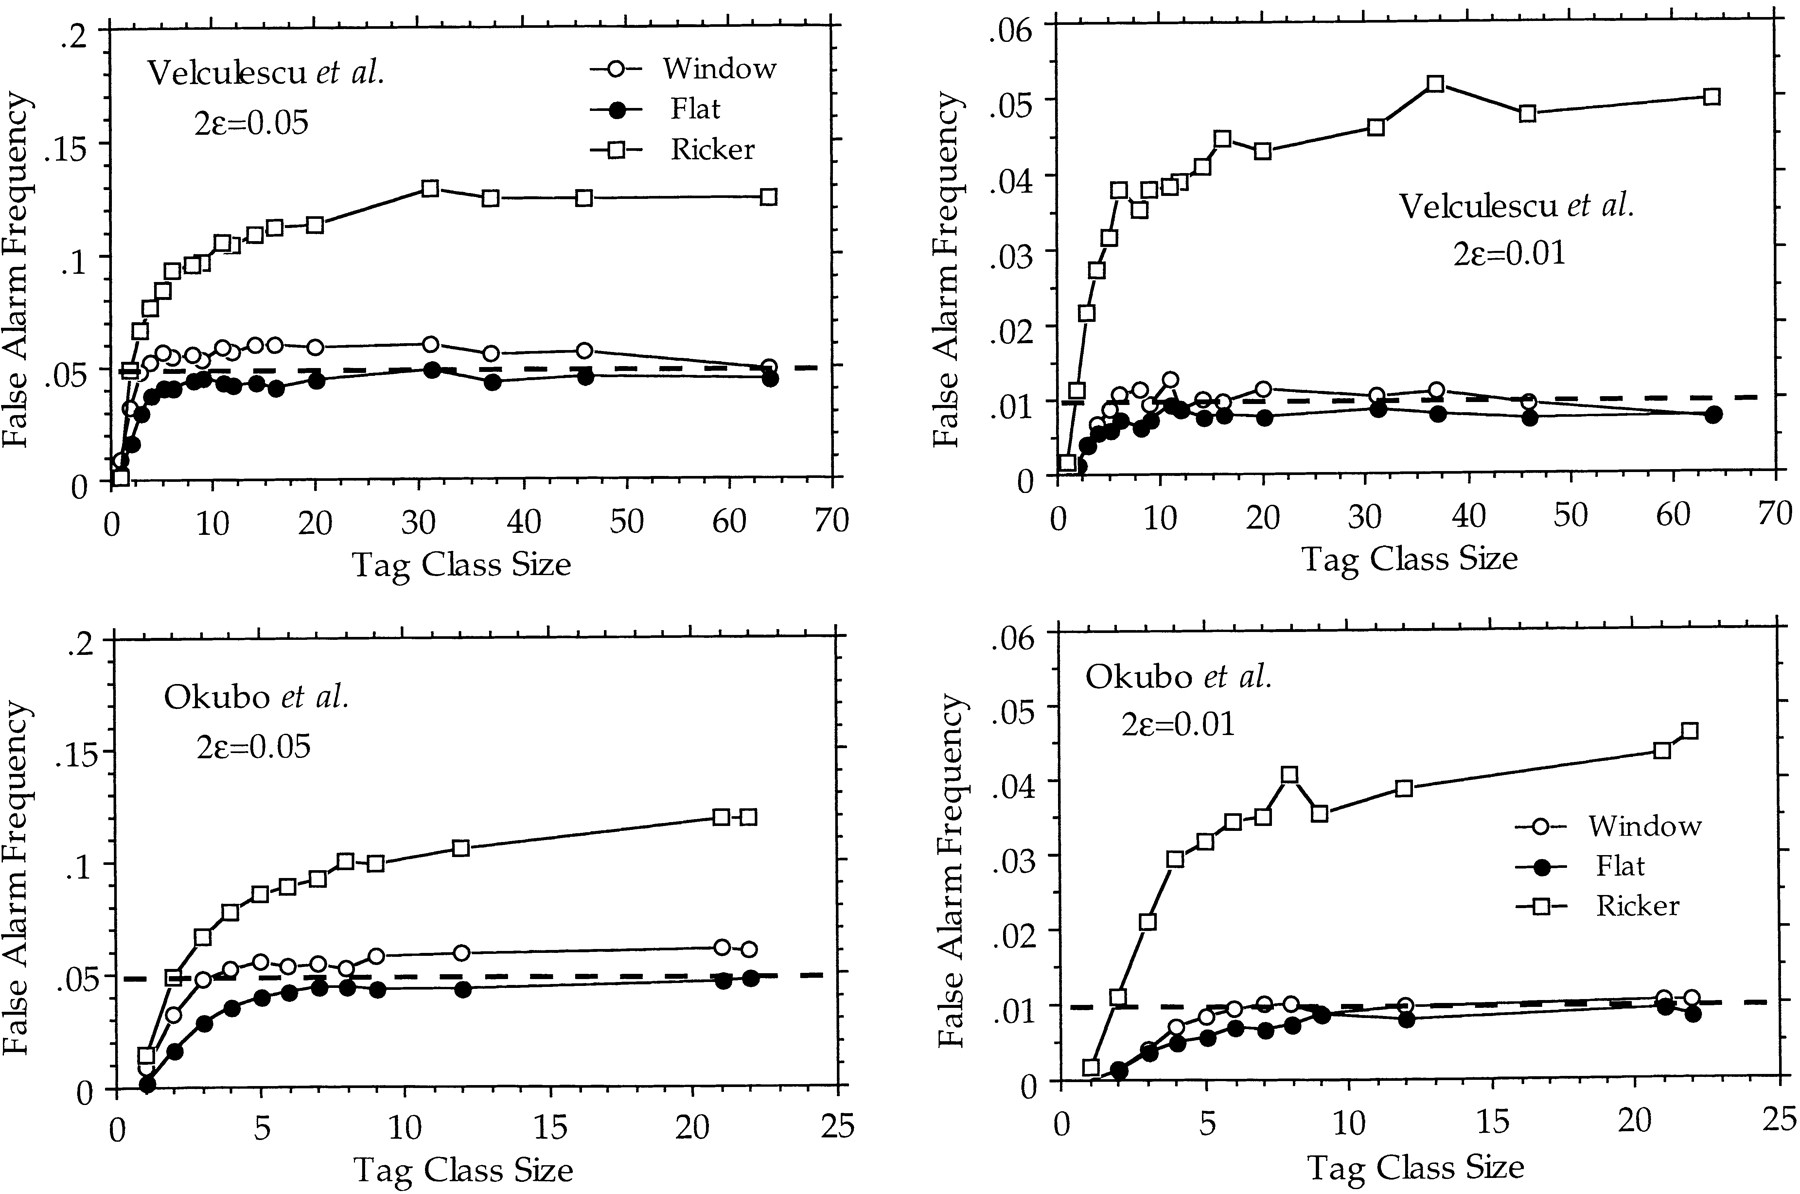
Rate of false alarm computed according to the confidence intervals listed in Table 1. (Top) Monte-Carlo simulation of the random sampling of 840 tags distributed according to the data from Velculescu et al. (1995; see Table 2). (Bottom) Monte-Carlo simulation of the random sampling of 982 ESTs distributed according to the data fromOkubo et al. (1992; see Table 2). The frequency of false alarm was computed for two significance levels (2ε = 5%, leftand 2ε = 1%, right) and plotted in function of the tag class size (from 1–64 for Velculescu et al., from 1–22 for Okubo et al.). In all cases, the rate of false alarm increases up to a plateau for larger class sizes. The test (cumulative form of Equation) derived from the flat p(λ) prior shows perfect behavior with a maximal rate of false alarm always less than the significance levels (broken lines). The test (cumulative form of Equation ) derived from the window p(λ) prior exhibits a slightly higher rate of false alarms. Both versions of the test exhibit conservative behaviors for class size <5, with a false alarm rate even less than expected. In contrast, Ricker’s confidence intervals (Equation 12) are grossly inadequate and lead to false alarm rates up to four times the significance level. Graphs are computed from the analysis of 1000 repetitions of each experiment.


