
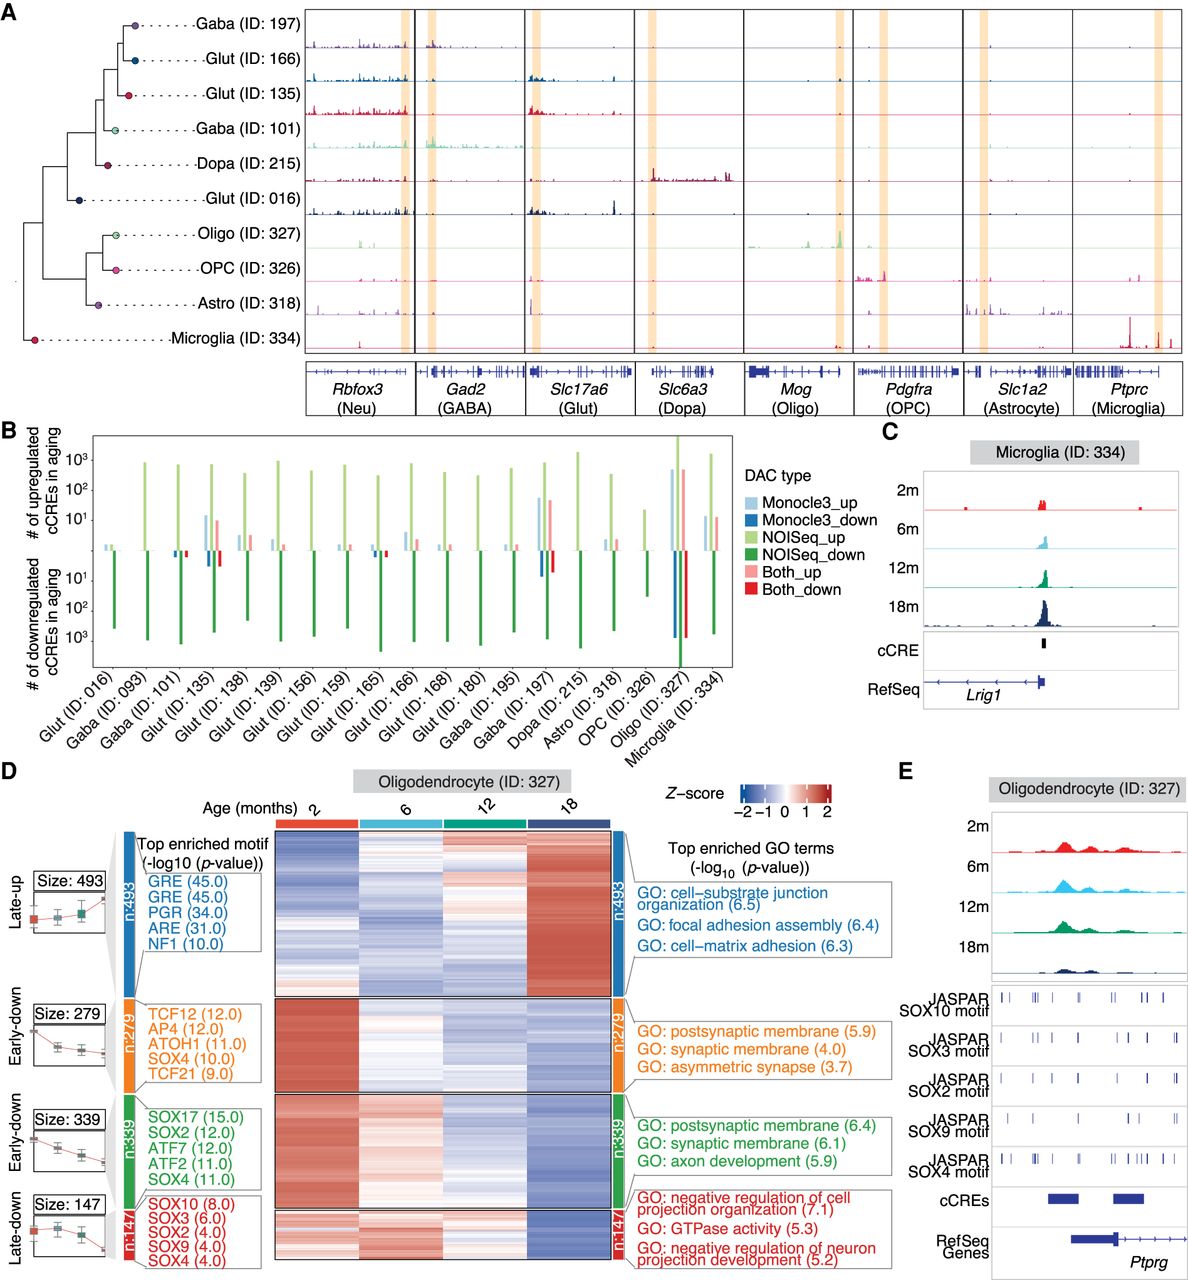
Age-associated differentially accessible cCREs across cell subclasses in the mouse substantia nigra. (A) Genome Browser tracks of aggregate chromatin accessibility profiles for representative subclasses at selected marker gene loci, with yellow blocks highlighting the representative regions. (B) Summary of the number of age-associated DACs (FDR < 0.05 for the Monocle3 model; probability > 0.95 for the NOISeq method) identified within each subclass, categorized by upregulated or downregulated effect size and colored by comparison models. up, upregulated DACs in aging; down, downregulated DACs in aging. (C) Genome Browser tracks of aggregate chromatin accessibility profiles for the microglia subclass across ages at a representative DAC locus. (D) Groups of age-associated DACs within oligodendrocytes subclass. From left to right: Box plots representing chromatin accessibility across ages for DAC groups. Top significant motif enrichments for cCREs of each DAC group in oligodendrocytes subclass. Heat map of pseudobulk chromatin accessibility for each DAC group across ages. Top significant GO and KEGG enrichments for cCREs of each DAC group in oligodendrocytes subclass. Late-up, late upregulated DACs in aging; Early-down, early downregulated DACs in aging; Late-down, late downregulated DACs in aging. (E) Genome Browser tracks of aggregate chromatin accessibility profiles for the oligodendrocytes subclass across ages at a representative DAC locus of the Late-down group in panel D. The predicated motif of the SOX family in the JASPAR database is shown at the bottom.


