
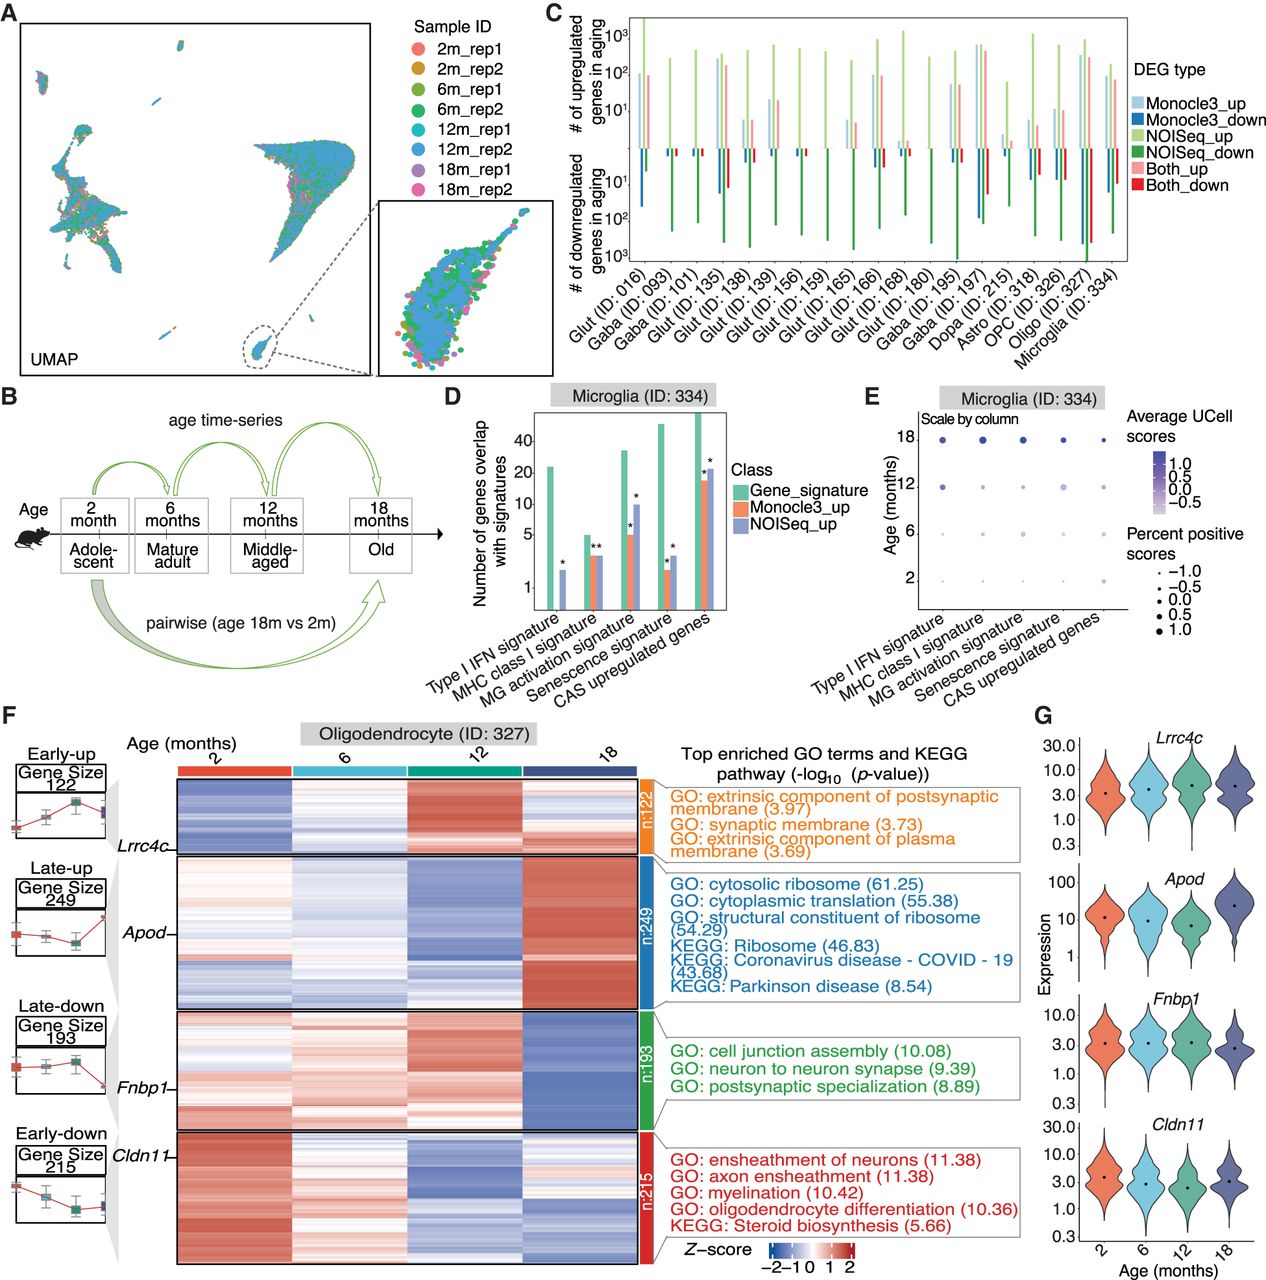
Profiling of age-associated gene expression variations across substantia nigra cell subclasses. (A) UMAP representation of all nuclei, colored by sample IDs. (B) The two comparison models used for age-associated differential expression analysis. (C) Summary of the number of age-associated DEGs identified within each subclass, categorized by upregulated or downregulated effect size and colored by comparison models (Monocle3 [Trapnell et al. 2014] linear model, FDR < 0.05; NOISeq [Tarazona et al. 2015] pseudobulk, probability > 0.95; and overlap in both methods). up, upregulated DGEs in aging; down, downregulated DEGs in aging. (D) Recurrence of age-related signatures in age-associated DEGs within the microglia subclass. Asterisks represent significant enrichment (FDR < 0.05) by hypergeometric test. IFN, interferon; MHC, major histocompatibility complex; MG, microglia; CAS, common aging score. (E) Dot plot representing the aggregated expression of age-related signatures across ages in the microglia subclass. Dot color and size represent the scaled average aggregated signature score calculated by UCell and scaled percent of positive scores of all nuclei, respectively. (F) Groups of age-associated DEGs within the oligodendrocytes subclass. Left: Box plots representing gene expression across ages for four DEG groups. Middle: Heat map of pseudobulk gene expression for each DEG group across ages. Right: Top significant GO and KEGG enrichments for genes in each DEG group in oligodendrocytes subclass. Early-up, early upregulated DEGs in aging; Late-up, late upregulated DEGs in aging; Early-down, early downregulated DEGs in aging; Late-down, late downregulated DEGs in aging. (G) Expression distribution of all nuclei in the oligodendrocytes subclass across ages for representative genes from the four age-associated DEG groups in panel F.


