
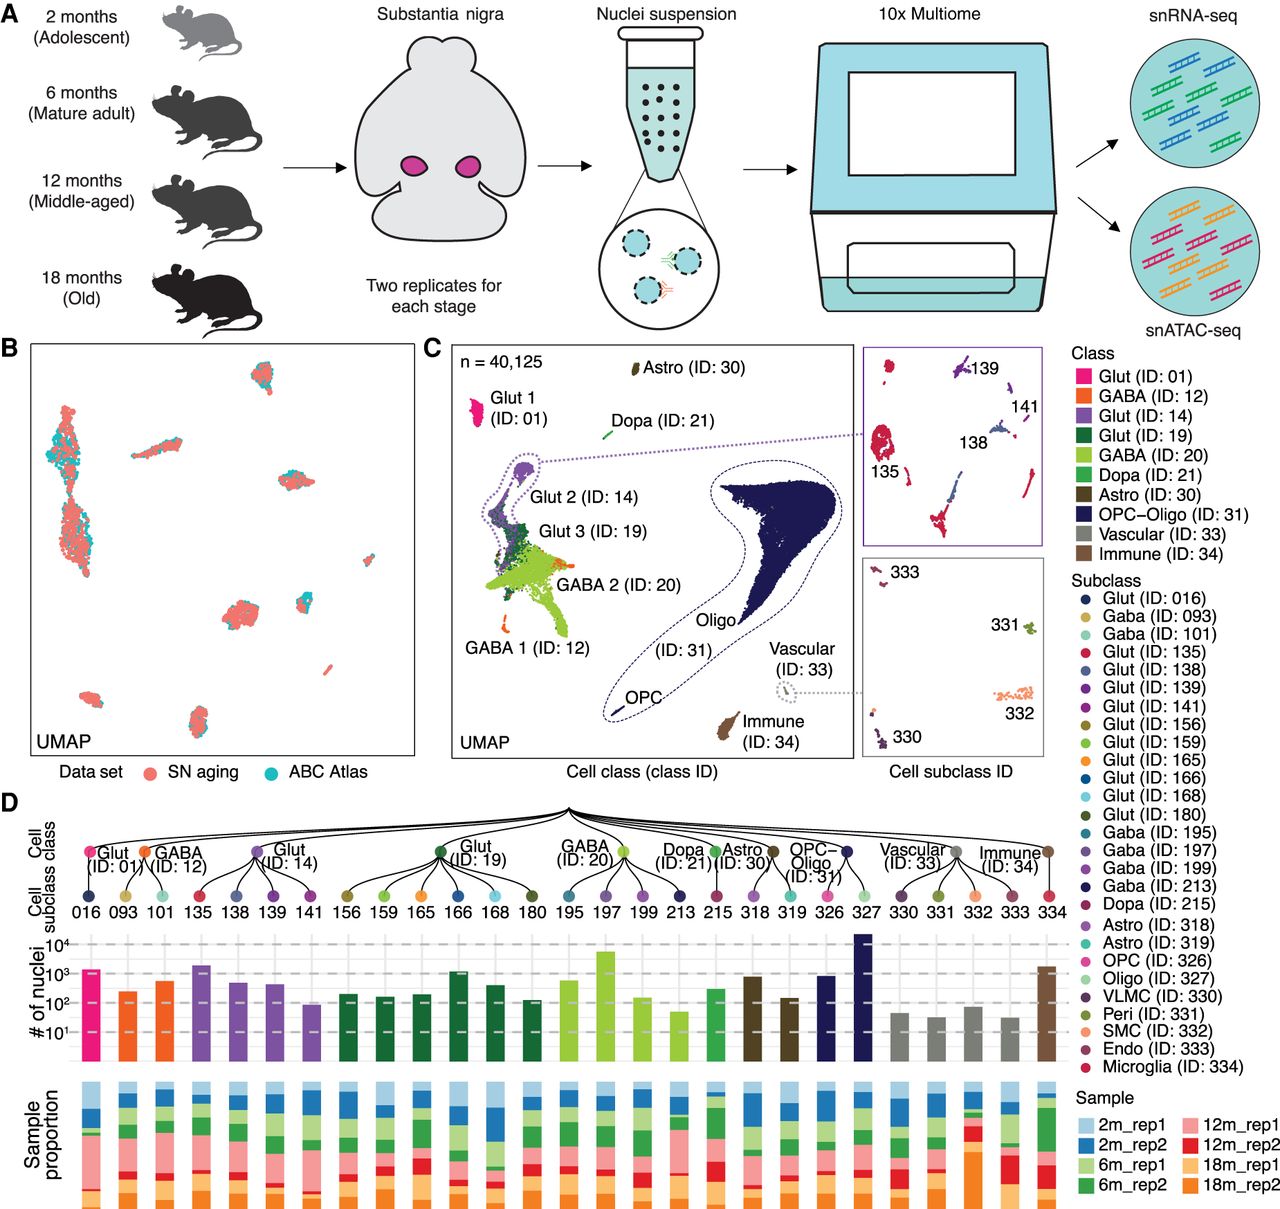
Single-nucleus multiomic analysis of the mouse substantia nigra across aging. (A) Schematic of the mouse substantia nigra samples analyzed, with 10x multiome data sets generated at four age stages: 2, 6, 12, and 18 months, with two replicates for each stage. (B) Coembedding UMAP (McInnes et al. 2018) of cells from the Allen Brain Cell (ABC) Atlas (Yao et al. 2023) scRNA-seq data and snRNA-seq data from this study, colored by data set. SN, substantia nigra. (C) UMAP embedding and clustering analysis of snRNA-seq data (n = 40,125 nuclei) from this study, with cells colored based on cell classes. The panels show examples where cell classes are separated into subclasses, and cells are colored based on cell subclass IDs. Cell class and subclass are annotated according to the ABC Atlas (Yao et al. 2023). Detailed information is provided in Supplemental Table S1. (Astro) astrocyte; (OPC) oligodendrocyte precursor cells; (Oligo) oligodendrocytes; (Glut) glutamatergic; (Gaba) GABAergic; (Dopa) dopaminergic; (VLMC) vascular leptomeningeal cells; (Peri) pericytes; (SMC) smooth muscle cells; (Endo) endothelial cells. (D) Top: Taxonomy tree of the 27 cell subclasses organized in a dendrogram, with cell class and subclass IDs marked. Middle: Bar plots representing the number of nuclei analyzed per subclass, colored by cell class. Bottom: Bar plots showing the proportion of nuclei in each sample for each subclass. 2 m: age 2 months; 6 m: age 6 months; 12 m: age 12 months; 18 m: age 18 months; rep1: replicate 1; rep2: replicate 2.


