
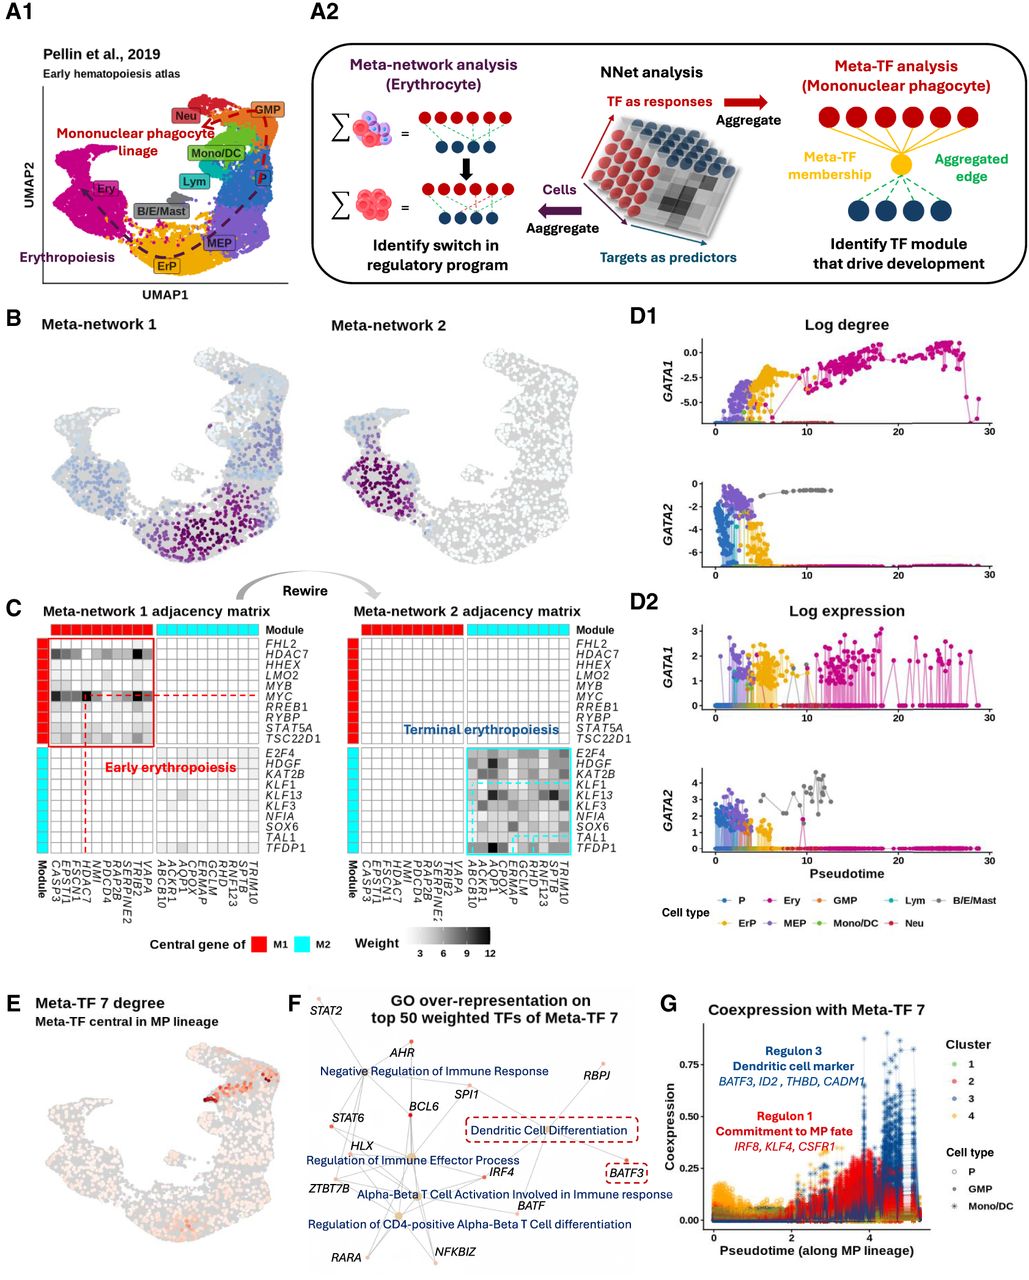
Dynamic coexpression network reveal key transcriptional program shifts during early hematopoiesis. (A) UMAP visualization of bone marrow Lin− cells, depicting the transcriptional landscape of early hematopoiesis (Pellin et al. 2019). P: progenitor, GMP: granulocyte-monocyte progenitor, MP: mononuclear phagocyte, Neu: neutrophil, Lym: lymphoid cell, Mast: Mast cell, MEP: megakaryocyte–erythroid progenitor, ErP: erythroid progenitor, Ery: erythrocyte. (B) Bipartite coexpression networks were constructed for individual cells, linking TFs to target genes. Nonnegative matrix factorization (NMF) was applied to (i) embed the cell dimension into meta-networks and (ii) or to embed the TF dimension into meta-TFs. Meta-network and meta-TF analyses were used to resolve erythropoiesis (B,C) and mononuclear phagocyte (MP) differentiation (E–G). (B) Meta-network analysis assigns cell weights that define soft clusters of cells based on their coexpression patterns. Projecting the soft clusters onto a UMAP shows that the first two meta-networks capture major transcriptional program shifts during erythropoiesis. (C) Aggregating CSNs according to the soft clusters in B yields meta-networks 1/2 (early/late erythropoiesis) representing the clusters. Weighted adjacency matrices of meta-networks are shown as heatmaps. Top 10 TFs (rows) and targets (columns) from each meta-network reveal rewiring from a stemness-associated state (meta-network 1) to erythrocyte-autonomous programs (meta-network 2), indicating an abrupt transcriptional transition. (D) Continuous tracking of GATA gene (GATA1 and GATA2) regulatory dynamics during erythropoiesis. (D1) tracks changes in connectivity (log node degree) for GATA genes within CSNs during erythropoiesis. Compared to the gene expression patterns shown in (D2), connectivity provides a more precise representation of the regulatory dynamics of these TFs, highlighting a distinct switching behavior between GATA2 and GATA1. (E) Meta-TF analysis assigns TF weights that define modules (i.e., soft clusters) of TFs based on their coexpression patterns. Aggregating TFs according to these modules yields simplified CSNs that summarize meta-TF–target coexpression. Degree of meta-TF 7 across cells were projected onto the UMAP. Meta-TF 7 emerged as the first module associated with the MP lineage, displaying the highest connectivity within GMPs. (F) Over-representation analysis of the top 50 TFs that composes meta-TF 7 identifies immune differentiation pathways. TFs linked to the enriched terms are colored based on their weights on meta-TF 7. (G) Meta-TF 7’s coexpression with each target gene along pseudotime. Each scatter path represents a target. Targets were clustered into four groups based on their coexpression patterns, with clusters 1 and 3 showing staggered activation waves linked to MP commitment and CD141+ dendritic cell maturation.


